Every BTC/USD chart already contains the exact instant price stops being stretched and starts snapping back, and it is not the instant most traders think it is.
It is not the instant a green candle finally shows up after a red streak.
It is not the instant a headline calls the bottom.
It is not the instant someone in a group chat says "this is it."
It is not even the instant the indicator everyone already has open turns up.
It is a single, specific moment, buried inside three lines that were already sitting on the chart the whole time, built from the same closing prices every other trader is already staring at.
One of those lines is a moving average.
The other two are set a fixed distance away from it, in a unit almost nobody on a retail chart bothers to calculate by hand.
The distance is one number. The lookback behind it is another.
Neither number was invented for this page. Both trace back to parameters published decades ago by the person who built this exact method, and repeated since across nearly every major charting platform that offers it.
The moment price closes back inside that distance, on a BTC/USD 4-hour chart specifically, is the entire idea.
Not a feeling. Not a guess based on how the last few candles looked. One specific line, reclaimed, marked the instant it happens, with a small triangle sitting right on the candle where it occurred.
The exact two numbers behind it, what the reclaim actually looks like on a real BTC/USD chart, and the 9 exact steps to get it live on your own chart in the next few minutes, are all laid out below.
Nothing here is a promise about what happens after that reclaim. That part is still on you. But the moment itself, the one almost nobody is set up to actually see the instant it happens, is $7 and about 2 minutes away from being on your chart.
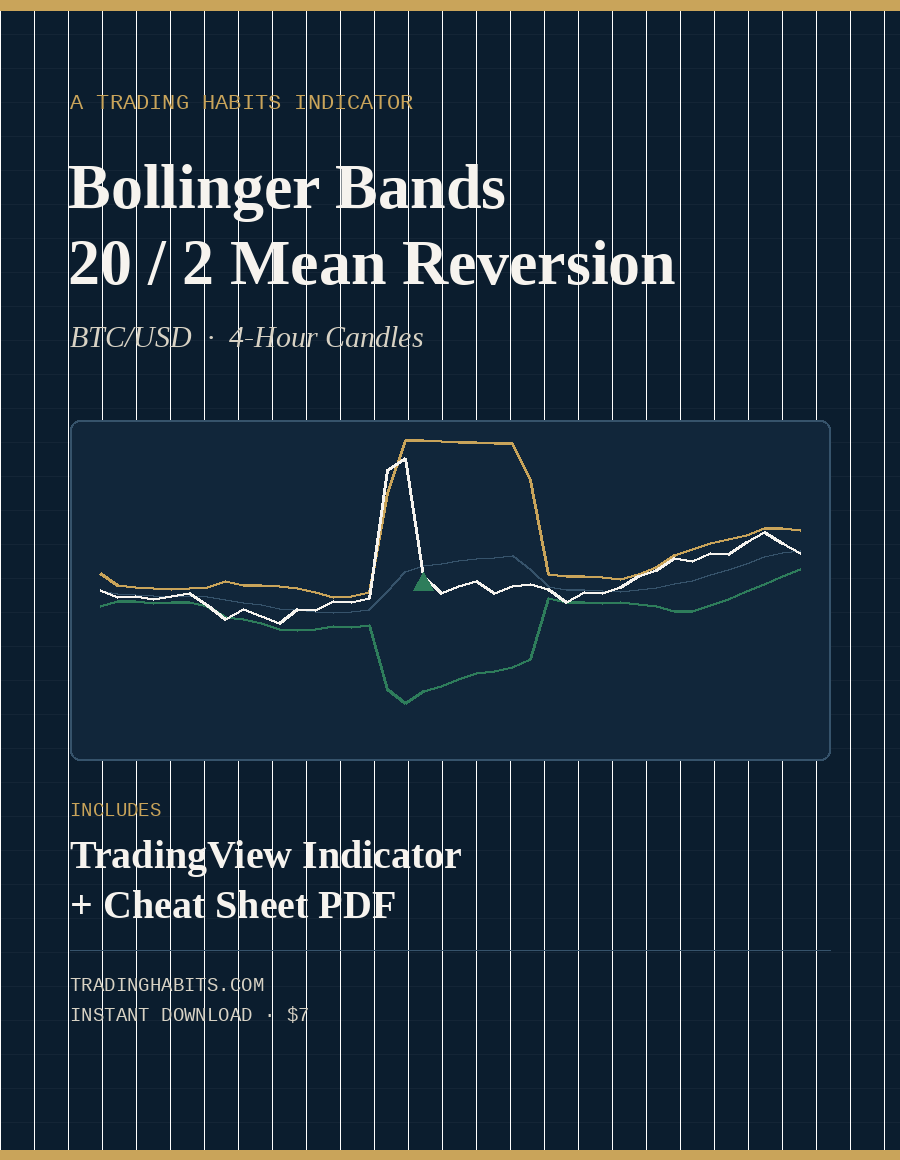
A Trading Habits Indicator
Bollinger Bands 20/2 Mean Reversion
The standard 20/2 Bollinger Band reclaim, coded for TradingView and tuned for BTC/USD on 4-hour candles.
- Includes A TradingView Indicator, plus a 7-page cheat sheet PDF
- Author TradingHabits.com
- Format Instant download, delivered right after checkout
- Covers What Bollinger Bands are and the logic behind them, the standard 20/2 parameters and where they come from, how to read the reclaim signals, and exact numbered install steps for TradingView
This is a standard, documented indicator, coded clean and tested live on a real chart before it shipped.
What's Inside
20 Things This Cheat Sheet Actually Says
- 01The one statistical measure that makes this indicator's bands widen and narrow on their own, without a single manual adjustment, and why that's different from a fixed-width channel, so the bands adjust to what BTC is actually doing right now instead of needing you to redraw anything by hand.Page 2
- 02Why this script can be read two completely different ways depending on the trader, and which one it was actually built for, so you're using the tool the way it was designed instead of forcing it into the wrong job.Page 2
- 03The exact word this cheat sheet uses for a close that lands outside a band, and the deliberate reason it isn't called a "signal" yet at that point, so you're not tempted to act on a single early candle before the setup is actually confirmed.Page 2
- 04Why this script waits an entire extra candle before marking anything, and what kind of false alarm that single delay is designed to filter out, so you're not reacting to every quick poke outside the band that reverses right back in.Page 2
- 05The specific decade John Bollinger published the two default numbers inside this script, and why neither one was invented for this product, so you're working from a documented standard instead of a number someone guessed at.Page 3
- 06What a 20-candle lookback actually adds up to in real time on a 4-hour BTC chart, down to the exact number of days, so you can picture exactly how much market history is shaping the bands at any moment.Page 3
- 07The statistical reason a 2 standard deviation band width was chosen over a narrower or wider multiple, tied to a specific percentage of closes, so you know roughly how often price is expected to sit inside the bands versus outside them.Page 3
- 08The one sentence this cheat sheet uses to admit that its own default settings are not fixed rules, and what it invites a trader to do about that, so you know these settings are a starting point you're free to test, not a rule carved in stone.Page 3
- 09Why Bitcoin's trading schedule specifically was the deciding factor for this build, and what a stock or ETF chart has that a BTC/USD chart doesn't, so you understand exactly why this build couldn't just be copy-pasted onto a stock chart unchanged.Page 4
- 10The exact number of times a 4-hour BTC candle closes in a single day, and why that update pace was chosen over anything faster or slower, so you know exactly how often this indicator actually updates before you ever open the chart.Page 4
- 11The one sentence on this page that states, in plain terms, every other symbol and timeframe this specific product was not built or tested for, so you know precisely where this build's testing stops and your own homework has to start.Page 4
- 12The three colors this script actually plots on a live chart, and which line represents the basis versus the two outer bands, so you can read the chart at a glance instead of guessing which line means what.Page 5
- 13What has to happen on two separate candles, not one, before the green upward triangle appears anywhere on the chart, so a single fluky candle can't trigger a signal on its own.Page 5
- 14The mirror condition that fires the gold downward triangle, and which side of the channel it's tied to, so you're reading both directions of the same logic instead of only half of it.Page 5
- 15Nine numbered steps stand between opening TradingView and having this exact script live on a BTC/USD 4-hour chart, so the whole setup fits into a coffee break instead of an afternoon lost to a manual.Page 6
- 16What a real, zoomed-in screenshot of this script's own chart legend shows immediately after it was pasted into Pine Editor, and what its absence of a red banner actually proves, so you're seeing real proof it compiled clean instead of taking "it works" on faith.Page 6
- 17The two adjustable settings this script's gear icon exposes, beyond the basis length itself, so the script keeps working for you even if your own trading style shifts down the road.Page 6
- 18The four things this cheat sheet states, in a single sentence, that this script does not do on a trader's behalf, so your own risk decisions stay in your own hands instead of getting handed off to a chart tool.Page 7
- 19The specific lag built into every mean-reversion reclaim signal this script produces, and why it can never fire a moment earlier than it does, so you go in with eyes open about what confirmation costs, instead of expecting a crystal ball.Page 7
- 20Four named, independent sources this cheat sheet cites for its own parameter research, including the one written by Bollinger himself, so you can go check the history yourself instead of taking this cheat sheet's word for it.Page 7
HABITS
★
Certificate of Guarantee
60-Day, No-Questions-Asked
If Bollinger Bands 20/2 Mean Reversion doesn't earn its place in your indicator list, email us any time within 60 days of purchase for a full refund. No form to fill out. No reason required.
Instant Download
$7One-time payment. No subscription.
Order NowTRADINGVIEW INDICATOR + 7-PAGE CHEAT SHEET · DELIVERED IMMEDIATELY AFTER CHECKOUT · 60-DAY GUARANTEE