Every NQ1! 15-minute candle is already carrying a hidden line that has nothing to do with where the price is trading right now.
It isn't a moving average.
It isn't a support or resistance level someone drew by hand.
It's a level built entirely from how much the market has actually been moving, and it only ever tightens toward price, never away from it, until one specific moment flips it to the other side entirely.
That level was not picked by guessing. A veteran exit-strategy specialist built the formula behind it, and futures traders have leaned on it for decades.
This isn't a stop-loss you set once and forget.
It doesn't care what NQ1! did on any single 15-minute candle by itself.
It's a single trailing level built from volatility itself, and the exact 15-minute candle where price closes back through it, on NQ1! specifically, is the entire idea.
Not a feeling. Not eyeballing a line drawn by hand. One level, one flip, marked with a small triangle sitting right where it happened.
What that level is actually built from, the classic settings behind it, and the 5 exact steps to get it live on your own NQ1! chart in the next few minutes, are all laid out below.
Nothing here is a promise about what happens after that level flips. That part is still on you. But the moment itself, the one almost nobody has their chart set up to actually catch, is $7 and about 2 minutes away.
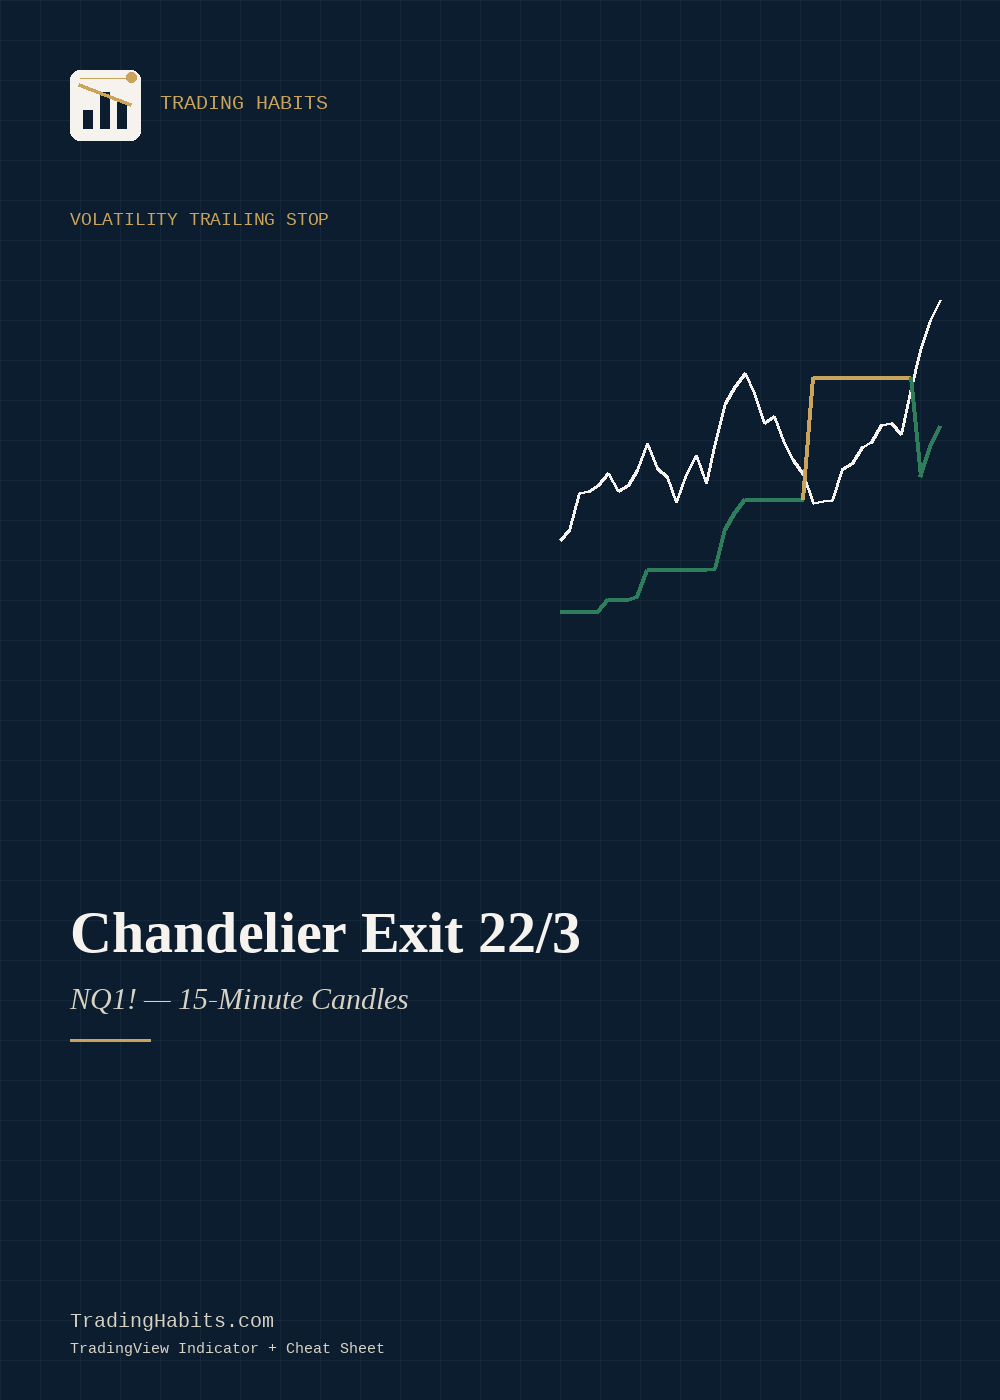
A Trading Habits Indicator
Chandelier Exit 22/3
Chuck LeBeau's classic 22-period, 3x ATR Chandelier Exit trailing stop, coded for TradingView and tuned for NQ1! E-mini Nasdaq-100 futures on 15-minute candles.
- Includes A TradingView Indicator, plus an 8-page cheat sheet PDF
- Author TradingHabits.com
- Format Instant download, delivered right after checkout
- Covers What the Chandelier Exit measures and the logic behind it, the standard 22-period / 3x ATR convention and where it comes from, how to read the signals, and exact numbered install steps for TradingView
This is a standard, documented indicator, coded clean and tested live on a real chart before it shipped.
What's Inside
20 Things This Cheat Sheet Actually Says
- 01This tool doesn't trail by a fixed dollar amount or a flat percentage. It trails by something that stretches and shrinks with the market itself, so that a calm session and a wild one never get treated the same way.Page 2
- 02A veteran exit-strategy specialist built this method around one core idea: the stop should never loosen once it's tightened, only the trend flipping resets it, so that you're never accidentally giving back more room than you already earned.Page 2
- 03There are two completely different formulas hiding in this indicator, one for an uptrend and one for a downtrend, and they mirror each other in a very specific way, so that the logic holds up no matter which direction the market is running.Page 2
- 04A single number gets multiplied against a volatility reading to decide exactly how far this stop sits from the recent extreme, and it's not a number this build made up.Page 3
- 05The lookback window baked into this script has a real-world reason behind its length, tied to how many sessions happen in a specific calendar period, so that the read matches a timeframe traders actually think in.Page 3
- 06One multiplier controls how wide or tight this stop runs, and the developer's own published starting point is exactly what's coded in here, not a guess.Page 3
- 07This build gives you a choice between two different price points to measure the extreme from, and the developer's own preferred version is set as the default, so that you're starting from his own tested approach.Page 3
- 08One specific futures contract was chosen for this build over dozens of other liquid instruments, and it comes down to how deep and consistent its liquidity actually is around the clock, so that the volatility reading isn't skewed by thin trading.Page 4
- 09The timeframe here isn't arbitrary. A specific number of hours' worth of price history sits behind every single reading, wide enough to filter noise without missing the session's real move, so that you're not reacting to every single-bar flicker.Page 4
- 10This exact combination of instrument and timeframe was picked to match a very particular trading horizon that one group of traders lives on, so that the settings actually fit how that instrument typically gets traded.Page 4
- 11There's only one line on this chart, but it changes color depending on something specific happening underneath it, so that you can tell which side of the trade this stop is protecting at a glance.Page 5
- 12Two triangle markers show up on this chart, and each one means something very different about which side just took over, so that you're never confusing a bullish flip for a bearish one.Page 5
- 13This line does something almost no other indicator line does: it can move toward price, but never back away from it, until one specific condition breaks that rule entirely, so that the protection it gives you can only get tighter, never looser.Page 5
- 14Five plain steps are all that stand between you and having this exact setup live on your own chart tonight, so that you're not stuck untangling code just to see it work.Page 6
- 15This exact script was pasted into a real, live futures chart and proven to compile clean before it ever got packaged, and that proof ships with it, so that you're not the one discovering a hidden error the day you actually need it.Page 6
- 16This line was never built to tell you when to get into a trade. It only tells you where a very specific kind of exit would sit if you were already in one, so that you know precisely what job it does and doesn't do.Page 7
- 17In one kind of market session, this line can flip sides back and forth several times in a short stretch, and that's explained honestly as expected behavior, not a flaw, so that repeated flips don't shake your confidence in the tool.Page 7
- 18There's a real, material risk difference between trading the instrument this script is built for and trading its underlying index directly, and it's stated plainly instead of buried, so that you understand what you're actually exposed to.Page 7
- 19Every number used in this build traces back to a real, citable source about how this method is traditionally applied, not a made-up figure dressed up to sound authoritative, so that you can check the claim yourself before you trust it.Page 8
- 20There's one thing this line will never manage for you, no matter how you configure it, and it's spelled out before you ever install it, so that you know exactly where its job ends and your own risk decisions begin.Page 7
HABITS
★
Certificate of Guarantee
60-Day, No-Questions-Asked
If Chandelier Exit 22/3 doesn't earn its place in your indicator list, email us any time within 60 days of purchase for a full refund. No form to fill out. No reason required.
Instant Download
$7One-time payment. No subscription.
Order NowTRADINGVIEW INDICATOR + 8-PAGE CHEAT SHEET · DELIVERED IMMEDIATELY AFTER CHECKOUT · 60-DAY GUARANTEE