Every QQQ daily candle is already carrying two separate numbers that most people staring at the price chart never once look at.
They aren't the open or the close.
They aren't a moving average drawn on top of the candles themselves.
They live in their own pane underneath the chart, and they've been quietly converging toward each other for the last several sessions.
The two numbers were not picked by guessing. A trader popularized this exact pairing in the late 1970s, and the charting world never really replaced it.
This isn't a single line.
It doesn't care what price did on any one candle by itself.
It's two lines built from price, and the exact daily candle where the faster one crosses back over the slower one, on QQQ specifically, is the entire idea.
Not a feeling. Not eyeballing two squiggly lines. One crossover, marked with a small triangle sitting right where it happened.
What those two lines actually are, the classic settings behind them, and the 5 exact steps to get this live on your own QQQ chart in the next few minutes, are all laid out below.
Nothing here is a promise about what happens after that crossover fires. That part is still on you. But the moment itself, the one almost nobody has their chart set up to actually catch, is $7 and about 2 minutes away.
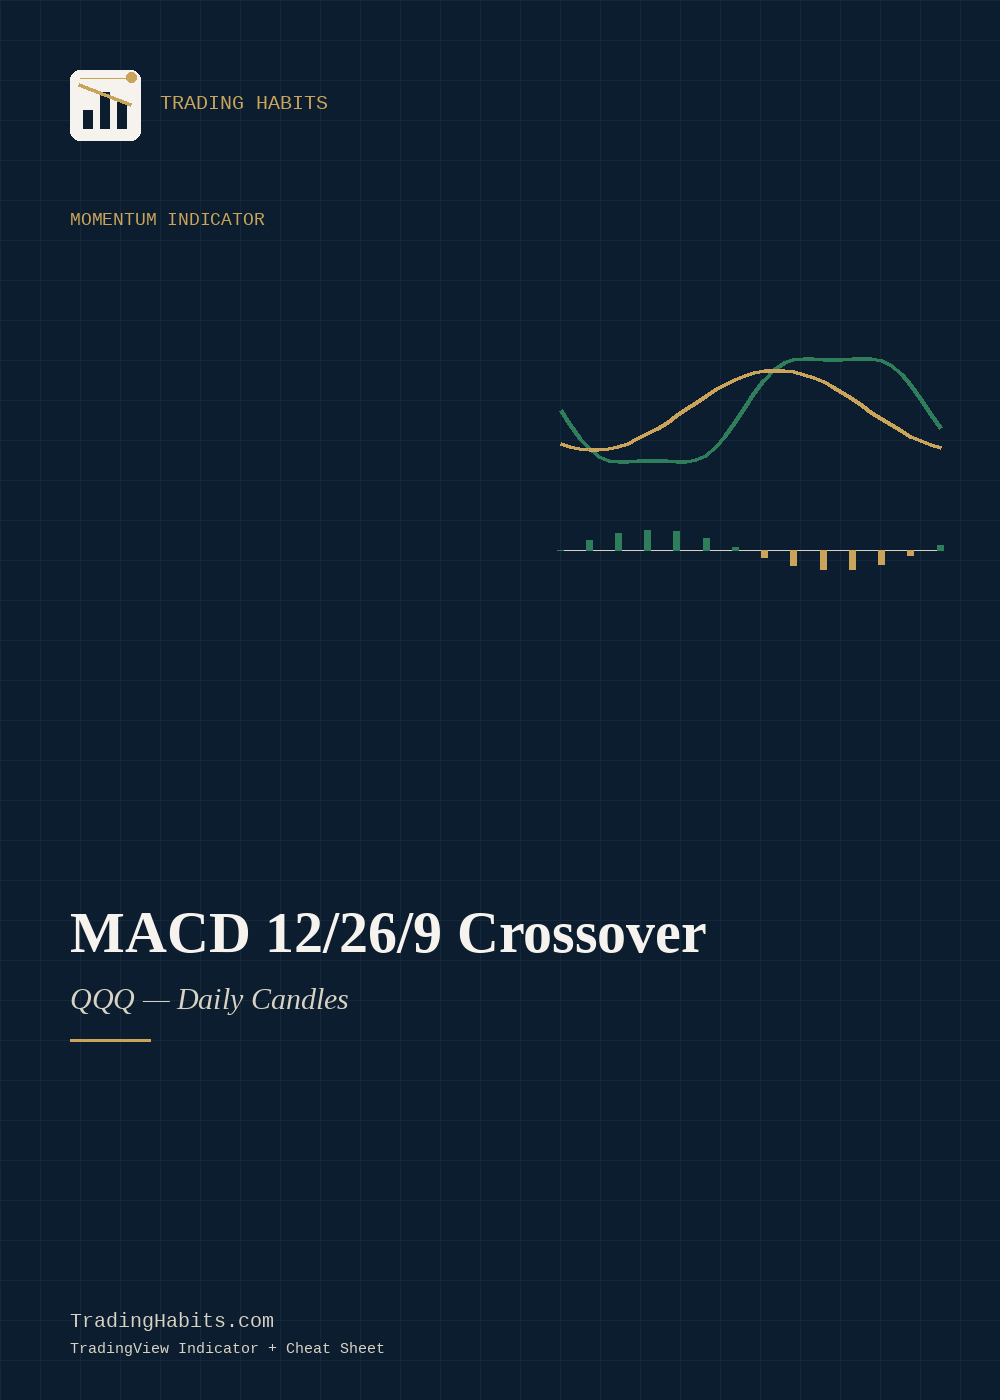
A Trading Habits Indicator
MACD 12/26/9 Crossover
Gerald Appel's classic 12/26/9 MACD crossover, coded for TradingView and tuned for QQQ on daily candles.
- Includes A TradingView Indicator, plus an 8-page cheat sheet PDF
- Author TradingHabits.com
- Format Instant download, delivered right after checkout
- Covers What MACD measures and the logic behind it, the standard 12/26/9 convention and where it comes from, how to read the signals, and exact numbered install steps for TradingView
This is a standard, documented indicator, coded clean and tested live on a real chart before it shipped.
What's Inside
20 Things This Cheat Sheet Actually Says
- 01There are two moving averages hiding inside this indicator, and they're not the same speed, so that you can see momentum shift before the price action alone makes it obvious.Page 2
- 02One line inside this tool is built entirely from the other, which is exactly what turns a simple average into a momentum signal, so that you're reading shifting speed instead of just price.Page 2
- 03There's a specific reason the bars underneath the two lines grow and shrink, and it has nothing to do with price direction by itself, so that you can spot a stall before the crossover even happens.Page 2
- 04A trading legend set three specific numbers back in the 1970s that almost every charting platform still defaults to today, and this script uses his exact numbers, so that you're never guessing whether the settings are arbitrary.Page 3
- 05Two of the numbers baked into this indicator are more than double each other, and that gap is the entire engine behind the signal, so that the read stays sensitive without getting noisy.Page 3
- 06There's a third, smaller number smoothing everything else in this script, and it's the one most people never think to ask about, so that the signal line doesn't just mirror the first two.Page 3
- 07This isn't tuned or optimized for this one chart. It's the same convention used on nearly every platform, applied as-is, so that you know exactly what you're looking at without a hidden custom twist.Page 3
- 08One specific fund gets singled out for this build, and it's not the one most people would guess first, so that the liquidity and data quality actually back up what the lines are showing you.Page 4
- 09The timeframe this script is tuned for isn't a coincidence, it's tied directly to when the original settings were designed, so that the math stays matched to its original intent instead of stretched thin.Page 4
- 10Speeding this same setup up to a much faster chart does something specific to how reliable the read is, and it's explained plainly on one page, so that you know exactly where this convention starts to break down.Page 4
- 11Two colors mark two very different moments on this chart, and only one of them means momentum just turned up, so that you're not left guessing which triangle means what.Page 5
- 12The bars underneath the lines aren't just decoration, they're the earliest visual tell that a crossover might be coming, so that you can watch for it before the lines actually touch.Page 5
- 13There's a specific reason both signals always show up after the fact, never before, and it's built into how the underlying averages are calculated, so that you understand the tradeoff going in instead of after a trade.Page 5
- 14A zero line sits underneath everything else on this chart, and where the momentum line sits relative to it changes what a crossover actually means, so that you can tell a strong signal from a weak one.Page 5
- 15Five numbered steps are all that stand between you and having this running on your own chart tonight, so that you're not stuck untangling code just to see it work.Page 6
- 16This exact script was pasted into a live, real chart before it ever got packaged up, and the proof is included, so that you're not the one discovering a compile error the day you actually need it.Page 6
- 17There's a specific kind of market condition where this indicator will fire the same signal several times in a row, and it's explained honestly instead of hidden, so that repeated signals don't catch you off guard.Page 7
- 18This tool is built to show you exactly one thing, and it deliberately does not try to do three or four other jobs at once, so that what it tells you stays clean and easy to trust.Page 7
- 19Every parameter used here traces back to a real, cited, publicly documented source, not a guess dressed up to sound credible, so that you can verify it yourself instead of taking it on faith.Page 8
- 20There's a specific limitation about what this indicator will never tell you, no matter how you set it up, and it's stated in plain language before you ever install it, so that you know precisely where its job ends and yours begins.Page 7
HABITS
★
Certificate of Guarantee
60-Day, No-Questions-Asked
If MACD 12/26/9 Crossover doesn't earn its place in your indicator list, email us any time within 60 days of purchase for a full refund. No form to fill out. No reason required.
Instant Download
$7One-time payment. No subscription.
Order NowTRADINGVIEW INDICATOR + 8-PAGE CHEAT SHEET · DELIVERED IMMEDIATELY AFTER CHECKOUT · 60-DAY GUARANTEE