Every TSLA chart is already carrying a second number nobody put there on purpose, updated every 15 minutes, that has nothing to do with the candles.
It isn't a moving average.
It isn't a support line someone drew by hand.
It isn't volume, and it isn't an oscillator bounded between two fixed levels.
It's a single comparison, run over and over, between right now and a fixed point 12 bars back, and almost nobody watches the exact instant it flips from negative to positive or back again.
That comparison isn't new. It's decades old, documented on every major charting platform, and it still runs on the same 12-bar window it always has.
This isn't a lagging trend overlay.
It doesn't smooth anything or average anything away.
It's one number that crosses one line, on TSLA specifically, every 15 minutes, and the exact bar where that happens is the entire idea.
Not a feeling. Not eyeballing a squiggly line. One number, one cross, marked with a small triangle sitting right where it happened.
What that number is actually measuring, the exact line it's built to cross, and the 9 exact steps to get it live on your own TSLA chart in the next few minutes, are all laid out below.
Nothing here is a promise about what happens after that number crosses. That part is still on you. But the moment itself, the one almost nobody has set up their chart to actually see the instant it happens, is $7 and about 2 minutes away.
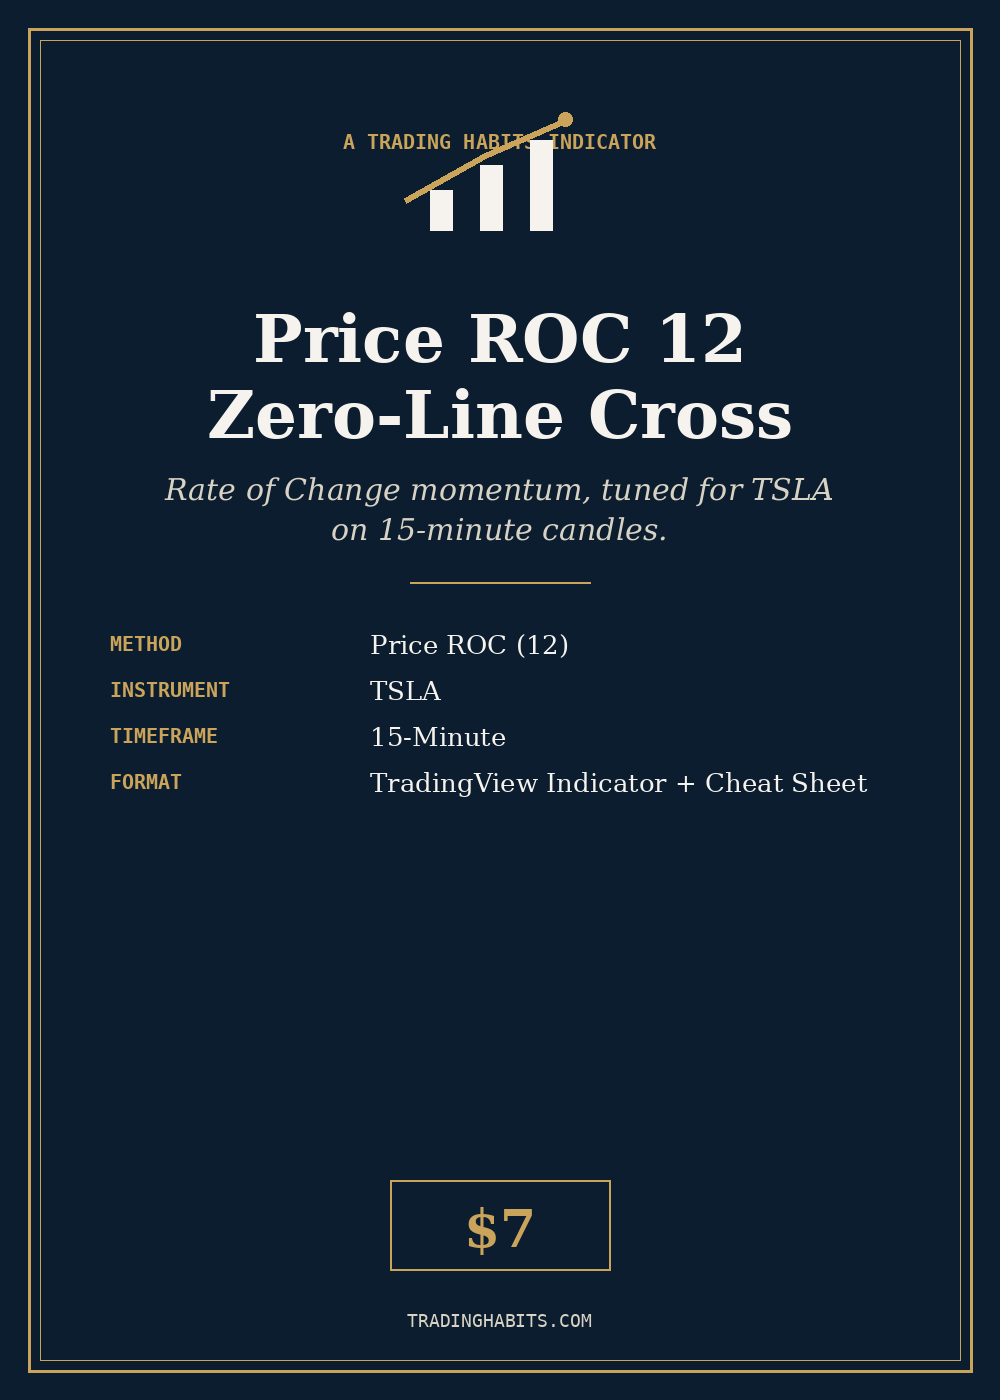
A Trading Habits Indicator
Price ROC 12 Zero-Line Cross
The standard 12-period Rate of Change zero-line signal, coded for TradingView and tuned for TSLA on 15-minute candles.
- Includes A TradingView Indicator, plus a 7-page cheat sheet PDF
- Author TradingHabits.com
- Format Instant download, delivered right after checkout
- Covers What ROC measures and the logic behind it, the standard 12-period convention and where it comes from, how to read the signals, and exact numbered install steps for TradingView
This is a standard, documented indicator, coded clean and tested live on a real chart before it shipped.
What's Inside
20 Things This Cheat Sheet Actually Says
- 01The exact two-point comparison this entire indicator boils down to, and the one thing it deliberately never averages or smooths along the way, so you're reading a raw momentum signal instead of a delayed, blended one.Page 2
- 02Why this indicator can swing quickly on short timeframes, and the specific reason this cheat sheet calls that expected, not a flaw, so a jumpy reading doesn't have you second-guessing a tool that's working exactly as designed.Page 2
- 03The exact two events, and only two events, this script is built to watch for around the ROC line, so you're tracking two specific things instead of a pane full of noise competing for your attention.Page 2
- 04The one line of math this cheat sheet prints in full, letter for letter, so you can verify the calculation yourself instead of taking a black-box indicator on faith.Page 2
- 05What separates this indicator from a moving average, stated directly, in one plain sentence, so you know exactly what kind of signal you're reading before you ever add it to a chart.Page 2
- 06Three named sources this cheat sheet cites for where the 12-period default actually comes from, so you can go check the history yourself instead of taking this cheat sheet's word for it.Page 3
- 07Why zero isn't a threshold picked for this product, and what it actually represents inside the math itself, so you understand the signal is measuring something real, not an arbitrary line.Page 3
- 08What happens to the line when you shorten the lookback versus lengthen it, and which direction trades off against which, so you can adjust it with your eyes open instead of guessing.Page 3
- 09The one setting inside this script's gear icon that isn't locked to the documented default, and what adjusting it costs you, so any change you make is a deliberate choice, not an accident.Page 3
- 10The specific property this cheat sheet says TSLA has that makes a 12-bar lookback worth calculating in the first place, so you understand why the instrument underneath a signal matters as much as the signal itself.Page 4
- 11How many hours of price history sit behind a single reading on this exact timeframe, spelled out as real clock time, not just "12 bars," so you can picture what the number is actually comparing.Page 4
- 12Where 15-minute candles sit between two other common intraday windows, and the specific tradeoff that position is built to solve, so you understand the tradeoff behind the choice instead of just accepting a number on a settings panel.Page 4
- 13What color the pane turns above zero versus below it, and what that shading is meant to let you see without reading a single number, so you can read momentum direction at a glance.Page 4
- 14What has to happen on the candle's close, not just a touch of the zero line, before this script will call something a cross, so a stray wick doesn't send you chasing a move that never actually confirmed.Page 5
- 15The exact shape and color used for a bullish marker versus a bearish one, and where each one sits relative to the line, so you can glance at a live chart and know instantly what just happened.Page 5
- 16What this cheat sheet states outright about what this script has zero knowledge of regarding the person using it, so your own risk decisions stay in your own hands instead of getting handed off to a script.Page 5
- 17Nine numbered steps stand between opening TradingView and having this indicator live and alerting on a TSLA chart, so the whole setup fits into a coffee break instead of an afternoon lost to a manual.Page 6
- 18The exact confirmation message TradingView itself displayed, timestamped, the moment this script compiled clean on a live chart, so you're seeing actual proof it works instead of taking "it works" on faith.Page 7
- 19What this cheat sheet calls "expected behavior, not a flaw" during a choppy, sideways stretch on the chart, so a rough patch doesn't have you doubting a tool that's doing exactly what it was built to do.Page 7
- 20What this cheat sheet says was never run to produce this product, and the specific claim it explicitly refuses to make anywhere inside it, so what you're buying is an honest tool, not a sales pitch dressed up as one.Page 7
HABITS
★
Certificate of Guarantee
60-Day, No-Questions-Asked
If Price ROC 12 Zero-Line Cross doesn't earn its place in your indicator list, email us any time within 60 days of purchase for a full refund. No form to fill out. No reason required.
Instant Download
$7One-time payment. No subscription.
Order NowTRADINGVIEW INDICATOR + 7-PAGE CHEAT SHEET · DELIVERED IMMEDIATELY AFTER CHECKOUT · 60-DAY GUARANTEE