Every GLD hourly candle is already carrying a hidden number that has nothing to do with the price printed on the chart.
It isn't the price.
It isn't the volume bar underneath it.
It's a separate reading, moving between 0 and 100, tucked into its own pane below the candles, and almost nobody watches the two specific moments it climbs back out of the far edges of that range.
Those edges were not picked by guessing. A trader set them decades ago on a simple idea: momentum tends to turn before price does.
This isn't a moving average.
It doesn't care what GLD's price did on any single candle by itself.
It's a single reading built from where the close sits inside its own recent range, and the exact hourly candle where it crosses back out of one extreme, on GLD specifically, is the entire idea.
Not a feeling. Not eyeballing a wiggly line near the top or bottom of a pane. One number, one cross, marked with a small triangle sitting right where it happened.
What that reading is actually measuring, the classic settings behind it, and the 5 exact steps to get it live on your own GLD chart in the next few minutes, are all laid out below.
Nothing here is a promise about what happens after that number crosses. That part is still on you. But the moment itself, the one almost nobody has their chart set up to actually catch, is $7 and about 2 minutes away.
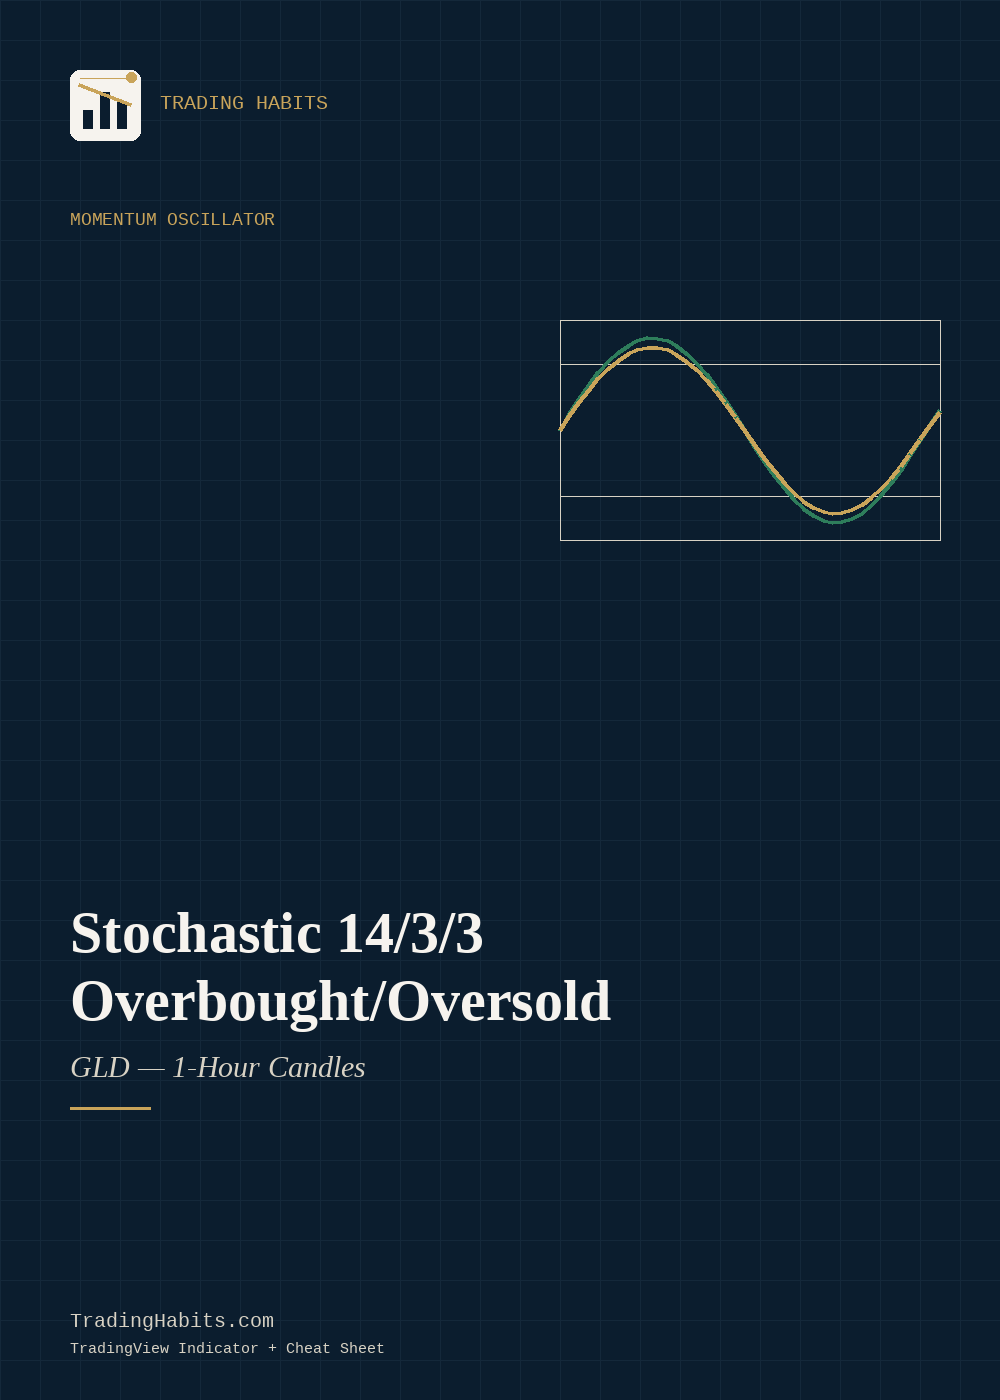
A Trading Habits Indicator
Stochastic 14/3/3 Overbought/Oversold
George Lane's classic 14/3/3 Stochastic Oscillator with 80/20 signals, coded for TradingView and tuned for GLD on 1-hour candles.
- Includes A TradingView Indicator, plus an 8-page cheat sheet PDF
- Author TradingHabits.com
- Format Instant download, delivered right after checkout
- Covers What the Stochastic Oscillator measures and the logic behind it, the standard 14/3/3 convention and where it comes from, how to read the signals, and exact numbered install steps for TradingView
This is a standard, documented indicator, coded clean and tested live on a real chart before it shipped.
What's Inside
20 Things This Cheat Sheet Actually Says
- 01This indicator doesn't measure price directly. It measures something else about where the close sits, so that you're reading momentum instead of just watching the candles bounce.Page 2
- 02A trader from the late 1950s built this whole method around one idea about what tends to move before price does, so that you're working off a principle that's outlasted six decades of markets.Page 2
- 03There are two lines in this indicator, and one of them is just a smoothed-out version of the other, so that the signal doesn't whipsaw on every single tick.Page 2
- 04The scale this indicator lives on has a very specific range, and knowing what the two extremes of that range actually mean changes how you read every signal it gives.Page 2
- 05Three numbers control this entire indicator, and they're the same three numbers most charting platforms default to without anyone asking why, so that you're never left wondering if the setup is arbitrary.Page 3
- 06Two specific levels mark the boundary between normal and extreme readings, and they're not round numbers chosen for looks, so that you know exactly where the "too far" line actually sits.Page 3
- 07This exact 3-number combination has a name in trading circles, and it's the version most associated with swing and medium-term reads, so that you know which style of trading this convention was built for.Page 3
- 08One specific metal-backed fund was chosen for this build over every other liquid asset out there, and the reason comes down to spread and consistency, so that the readings aren't distorted by thin trading.Page 4
- 09The timeframe here sits in a very particular spot between two extremes, and that placement is deliberate, so that the lookback window is wide enough to matter without missing the move.Page 4
- 10A specific number of trading days' worth of hourly bars sit behind every single reading this indicator produces, so that you know exactly how much history is baked into each signal.Page 4
- 11Two shaded lines and two colored triangles all work together on this chart, and only one combination of them means a reversal out of the extreme zone, so that you're not misreading a false signal as the real one.Page 5
- 12There's a very specific condition both lines have to satisfy at the same time before a marker appears, and it's stricter than just one line crossing the other, so that the signal isn't triggered by noise alone.Page 5
- 13Every signal this indicator produces is confirmed only after the close, never before, and that timing detail changes what you should expect from it, so that you're not anticipating something the indicator was never built to predict.Page 5
- 14Five plain steps are all that separate you from having this exact setup live on your own chart tonight, so that you're not stuck troubleshooting code just to see it work.Page 6
- 15This exact script was pasted into a real, live chart and proven to compile clean before it ever got packaged, and that proof ships with it, so that you're not the one finding a hidden error the day you need it.Page 6
- 16There's a specific market condition where this indicator can stay pinned near one extreme for a long stretch without ever reversing, and it's explained plainly instead of glossed over, so that a strong trend doesn't trick you into reading it as "overbought means reverse."Page 7
- 17In one kind of session, this indicator will fire the same signal several times in short succession, and that's called out directly as expected, not a flaw, so that repeated signals don't shake your confidence in the tool.Page 7
- 18This tool does exactly one job and stops there, deliberately leaving position size and risk decisions entirely up to you, so that what it tells you never gets confused with a full trading system.Page 7
- 19Every number used in this build traces back to a real, citable source about how this method is traditionally applied, not a made-up figure dressed up to sound authoritative, so that you can check the claim yourself.Page 8
- 20There's one thing this indicator will never promise you, no matter how you configure it, and it's stated up front before you even install it, so that you know exactly where its job ends and your judgment has to take over.Page 7
HABITS
★
Certificate of Guarantee
60-Day, No-Questions-Asked
If Stochastic 14/3/3 Overbought/Oversold doesn't earn its place in your indicator list, email us any time within 60 days of purchase for a full refund. No form to fill out. No reason required.
Instant Download
$7One-time payment. No subscription.
Order NowTRADINGVIEW INDICATOR + 8-PAGE CHEAT SHEET · DELIVERED IMMEDIATELY AFTER CHECKOUT · 60-DAY GUARANTEE