Every trader who has ever followed a plan perfectly has, at some point, taken a trade the plan never actually called for.
Not because a setup appeared.
Not because of news, or a level breaking, or anything that showed up on the chart.
Not because a single rule got broken on paper.
They took it because the screen had gone quiet, the day felt like it was owed some action, and sitting still had become the hardest part of the job.
It's not the size. It's not the stop. It's not even an actual setup, dressed up to look like one.
Researchers who've studied it under lab conditions have a name for the specific stretch of the session where this happens most, and it isn't random. It's scheduled, every single day, whether anyone notices it or not.
This exact habit has been measured in a published study, in brokerage data, and in an original 20,000-account simulation built specifically to isolate what one of these trades a day actually does over a full year.
Once you see the specific expected value of the trade with nothing behind it, sitting right next to the expected value of the trade the plan actually called for, "it's one small trade" stops sounding like nothing.
The traders who've caught this in their own numbers didn't catch it by feel. They caught it by running the exact math laid out below, against two hypothetical accounts and a full year of simulated sessions.
A Trading Habits Report
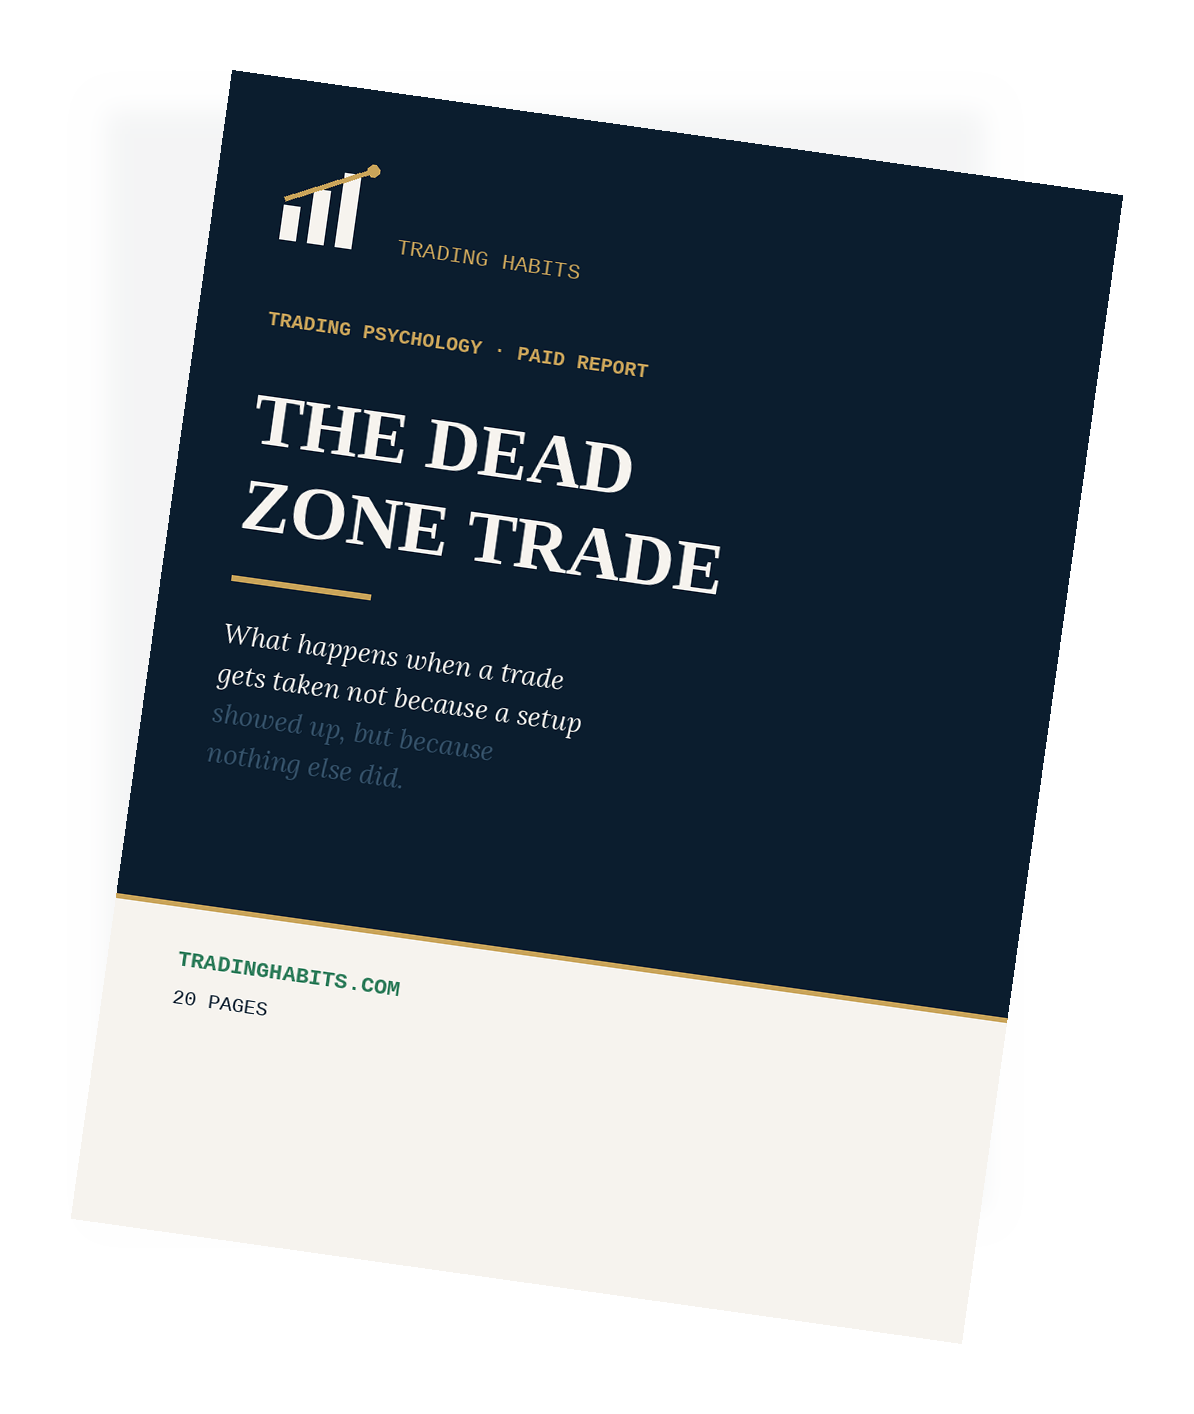
The Dead Zone Trade
What happens when a trade gets taken not because a setup showed up, but because nothing else did.
- Length 20 pages, with 8 original charts and two worked hypothetical case studies
- Author TradingHabits.com
- Format PDF, delivered as an instant download right after checkout
- Covers The documented psychology of sensation-seeking and anticipation, the research on gamified trading-app design, the market's own scheduled low-volume "dead zone," two worked case studies, and a 20,000-account simulation comparing signal-only trading against signal trading plus one boredom trade a day
This report breaks down the research, the math, and the numbers on one specific decision.
What's Inside
20 Things This Report Actually Says
- 01The four exact ways this habit shows up, and why none of them require a single broken rule to do actual damage.Page 3
- 02What a pending trade does to the brain before anyone knows if it wins or loses, and why that alone is enough to explain the click.Page 4
- 03The unlikely dataset (tax filings, driving records, and mandatory psychological profiles) researchers combined to prove this trait shows up in actual trading accounts, not only in surveys.Page 4
- 04The measurable multiplier between the least and most stimulation-driven traders' actual trading frequency, once other explanations are ruled out.Page 5
- 05What a university research team built into a fake trading app, with confetti and animations, to prove something uncomfortable about risk-taking.Page 6
- 06The exact dollar figure a major trading platform paid regulators in 2024 over the design features sitting on your own phone right now.Page 6
- 07The predictable, repeating shape trading volume takes across every single session, and the exact stretch of the day where this habit concentrates because of it.Page 7
- 08Three specific things change about market conditions during that stretch, and every one of them works against a trade with nothing behind it.Page 8
- 09A $5,000 account, a plan that's already positive for the day, and the exact clock time the trader decides to keep going anyway.Page 9
- 10The single missing ingredient that flips a trade's expected value from positive to negative, without changing the size at all.Page 10
- 11A $50,000 funded account, a fully contained morning, and the specific dollar cushion still sitting there before anything goes wrong.Page 11
- 12The exact percentage over its own daily limit one funded account ends up at, after three trades that individually looked completely reasonable.Page 12
- 13What separates the two groups of 20,000 simulated accounts in this report's core simulation, down to the single variable everything else holds constant.Page 13
- 14The dollar difference between two otherwise-identical account paths after one full simulated year, caused by something that happens on fewer than 1 trade in 7.Page 14
- 15Out of every winning day this report's model produces, the specific share that gets erased entirely by exactly one more trade.Page 15
- 16What a small, low-conviction habit costs a mid-five-figure account over five years, held completely flat, with the exact number attached.Page 16
- 17The clinical scale, built on the same diagnostic criteria used for gambling disorder, that traders scoring higher on also happen to check markets more and trade more often.Page 17
- 18The specific non-trading task this report recommends building into the exact hour of the day this habit is most likely to strike.Page 18
- 19Four sentences traders tell themselves right before this exact decision, and the specific page in this report that answers each one by number.Page 19
- 20The two modeled statistics behind every dollar figure in this report, disclosed by name on the last page, and why they were built instead of borrowed.Page 20
HABITS
★
Certificate of Guarantee
60-Day, No-Questions-Asked
If The Dead Zone Trade doesn't earn its place on your desk, email us any time within 60 days of purchase for a full refund. No form to fill out. No reason required.
Instant Download
$7One-time payment. No subscription.
Order Now20-PAGE PDF · DELIVERED IMMEDIATELY AFTER CHECKOUT · 60-DAY GUARANTEE
Behind The Report
Sensation-Seeking And Market Microstructure

Nothing is moving. The urge to make something happen anyway is the trade this report is about.
The Concept
Markets have a well-documented rhythm to their trading volume within a session: heavy near the open, heavy near the close, thin in between. That quiet middle stretch is where a trade with nothing behind it is most likely to get taken, not because a signal appeared, but because sitting still had gotten uncomfortable.
Sensation-seeking, the general personality trait of needing stimulation, turns out to predict trading behavior directly, not as a loose correlation but as a measured one.
Where It Comes From
Prem Jain and Gun-Ho Joh documented the U-shaped intraday volume pattern in a 1988 Journal of Financial and Quantitative Analysis paper, and Anat Admati and Paul Pfleiderer built a theoretical model of why it happens that same year in The Review of Financial Studies.
Mark Grinblatt and Matti Keloharju's 2009 Journal of Finance study is the standout here. Using Finnish driving records, they found that people with more speeding tickets also traded more often, direct evidence that sensation-seeking shows up in a trading account the same way it shows up behind the wheel. More recently, a 2024 Management Science study by Zoican, Chapkovski, and Khapko, alongside a 2023 Journal of the Association for Consumer Research study across more than 3,700 participants, both found that gamified app design, points, streaks, celebratory animations, measurably increases risk-taking. Massachusetts regulators cited that exact mechanism in a 2024 consent order against Robinhood, a $7.5 million enforcement action.
The U-Shaped Volume Curve Every Session Follows
Illustrative shape, not live data: the general U-curve Jain and Joh documented in 1988, volume heaviest in the first and last hour of a session, thinnest across the midday stretch, roughly noon to 2 p.m. Eastern.
Try It: Step Through The Session
Illustrative index derived from the same U-shaped curve plotted above, not a live feed. Drag through the session and watch the index bottom out through the midday stretch, which is exactly the stretch this report's research ties to boredom-driven, sensation-seeking trades.
Background only. The report itself works two account case studies and a 20,000-trial simulation of what one boredom trade a day actually costs.
Common Questions
Is there real research tying sensation-seeking to trading behavior?
Yes, and one study is unusually direct about it. Mark Grinblatt and Matti Keloharju's 2009 Journal of Finance study used Finnish driving records and found people with more speeding tickets also traded more often, evidence that sensation-seeking shows up in a brokerage account the way it shows up behind the wheel.
Does app design actually change how much risk people take?
Two separate studies found so: a 2024 Management Science paper and a 2023 Journal of the Association for Consumer Research study across more than 3,700 participants. Both found gamified elements, points, streaks, celebratory animations, measurably increase risk-taking. Massachusetts regulators cited that exact mechanism in a 2024 consent order against Robinhood, a $7.5 million enforcement action.
Why does the midday session matter specifically?
Trading volume follows a well-documented U-shape within a session, heavy near the open and close, thin in the middle, first mapped by Prem Jain and Gun-Ho Joh in a 1988 paper. That quiet middle stretch is where a trade with nothing behind it is most likely to get taken.
Sources & Further Reading
-
Jain, P. C. & Joh, G. H. (1988). “The Dependence between Hourly Prices and Trading Volume.” Journal of Financial and Quantitative Analysis, 23(3), 269-283.
Documented the U-shaped intraday volume pattern the chart above plots.
-
Admati, A. & Pfleiderer, P. (1988). “A Theory of Intraday Patterns: Volume and Price Variability.” Review of Financial Studies, 1(1), 3-40.
Built the theoretical model of why the U-shape happens, the same year Jain and Joh documented it empirically.
-
Grinblatt, M. & Keloharju, M. (2009). “Sensation Seeking, Overconfidence, and Trading Activity.” The Journal of Finance, 64(2), 549-578.
Used Finnish driving records and found people with more speeding tickets also traded more often.