There's a number missing from every trading platform's risk display, and it isn't missing by accident, because no single trade could ever show it to you.
It isn't the entry.
It isn't the stop.
It isn't even the size of any one position.
It's the number three separate 1% risk decisions add up to, the moment they stop being three separate decisions.
A paper written in 1952, for portfolios, not trading, hands you the exact formula for what that number is. A study of two of the biggest stock markets on earth found something worse: that number gets bigger, not smaller, at exactly the moment you need it not to.
There's an exact multiplier for what a handful of related positions actually carries once that formula is applied. Not a guess. Not a feeling about being "spread out." A closed-form number most position-sizing rules never account for.
A 20,000-trial simulation built for this report found something most traders would not expect: the average barely moves. What actually changes is a specific number, how often a genuinely bad round shows up, and it climbs sharply.
The formula, the 1952 paper, the 2001 study, the simulation, and 2 full hypothetical accounts walked through dollar by dollar are all laid out below, with the page number where each one lives.
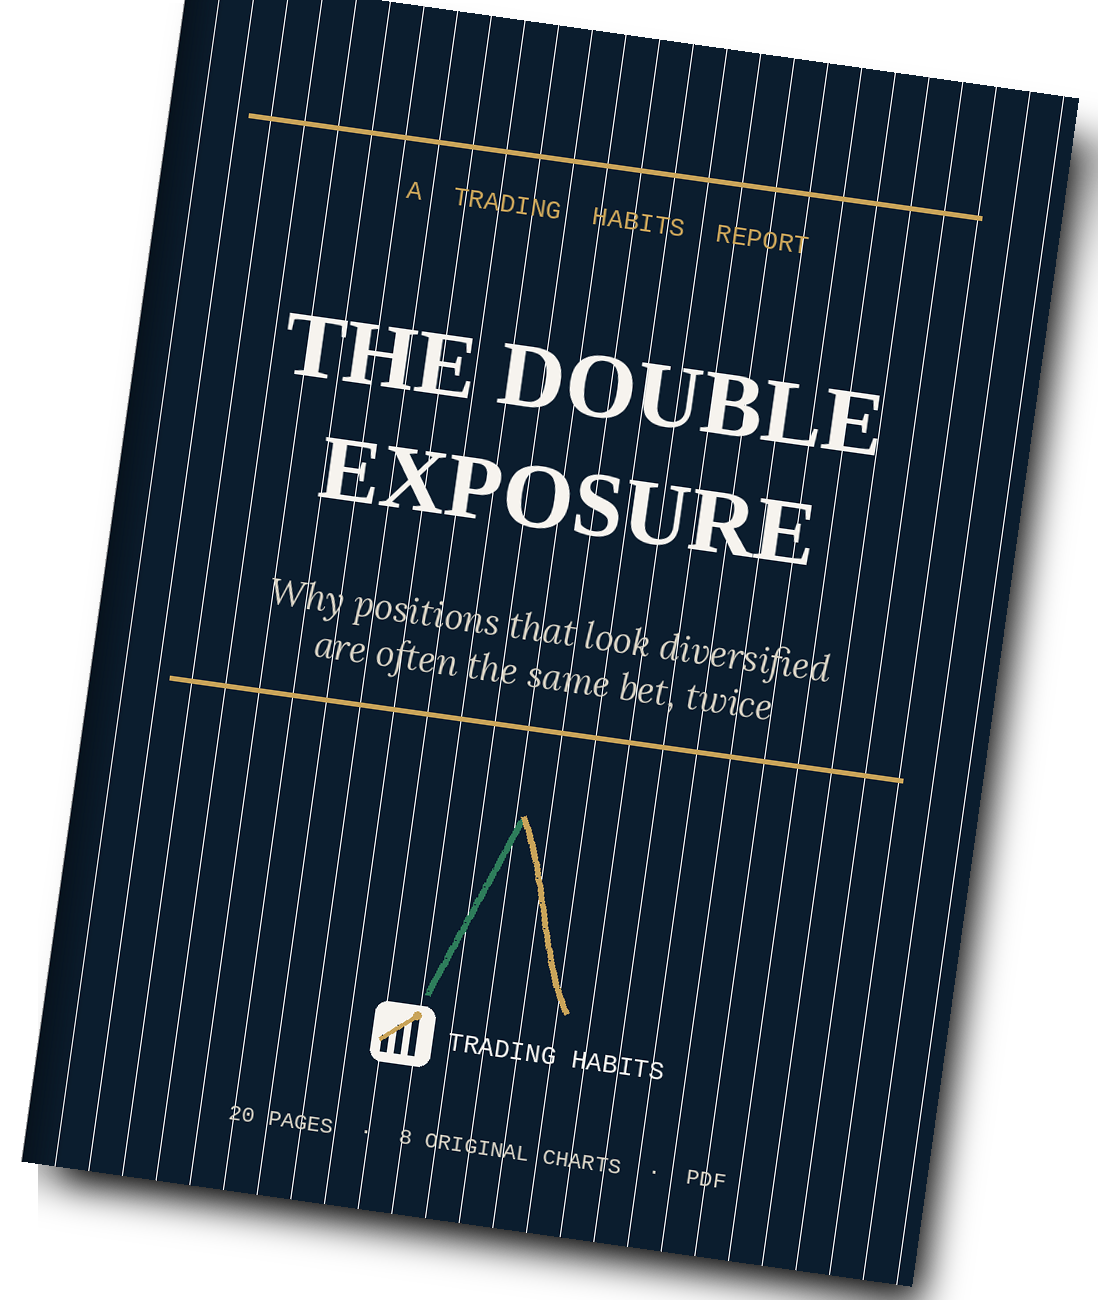
A Trading Habits Report
The Double Exposure
Why positions that look diversified are often the same bet, twice.
- Length 20 pages, with 8 original charts and two worked hypothetical case studies
- Author TradingHabits.com
- Format PDF, delivered as an instant download right after checkout
- Covers The exact math for combining correlated positions, 4 academic sources, a 20,000-trial simulation, and 5 written rules to size correlated positions as a group
This report breaks down the research, the math, and the numbers on one specific decision.
What's Inside
20 Things This Report Actually Says
- 01Why this is the only report in this shop about more than one position at the same time, and how a risk number that is completely correct on paper can still describe the wrong thing entirely.Page 2
- 024 specific shapes this mistake takes, including 1 that can happen entirely within a single currency's own family of pairs without ever repeating the same ticker.Page 3
- 03The one question every per-trade risk rule was never built to answer, spelled out in a single sentence.Page 4
- 04A single formula, not a guess, for exactly how much combined risk 2, 3, or 5 stacked positions carry once correlation gets added back in, plus the specific multiplier for 3 positions at a correlation level common between related pairs.Page 5
- 05A 1952 paper that never once mentions trading is the entire academic foundation for the difference between a portfolio and a pile of positions, quoted directly in its own words.Page 6
- 06A named decision-making shortcut from a 2001 study explains exactly how most people, including retirement savers, decide what to split their money across, and it has nothing to do with how those things move together.Page 7
- 07A 2008 study of actual brokerage accounts found underdiversification held up even among investors carrying the traits usually associated with more sophistication.Page 7
- 08A 2001 study of international stock markets found correlation moves in exactly the wrong direction at exactly the worst moment, and there's a blunt shorthand traders use for what that looks like once markets start falling.Page 8
- 09A hypothetical $5,000 account takes 3 trades that each individually follow the rules to the letter, and 1 single afternoon headline is all it takes for what happens next.Page 9
- 101 table turns "3 trades, $150 total risk" into the exact sentence a per-trade risk percentage could never write on its own.Page 10
- 11A hypothetical 5-position basket reads as diversified on a position list right up until it gets broken down piece by piece.Page 11
- 12The exact setup behind a 20,000-trial simulation built specifically for this report, including the single variable that changes between its two versions and nothing else.Page 12
- 13The simulation's biggest finding has almost nothing to do with the average outcome, and an exact percentage shows how much wider the range of results gets once correlation is added, plus how much more likely a specific bad round becomes.Page 13
- 14A curve shows the exact odds of a bad combined round climbing continuously as correlation rises, and why 5 loosely related positions can carry less actual risk than 3 tightly related ones.Page 14
- 15The same 100 simulated rounds, run twice with only 1 input changed, produce 2 ending balances close enough to look almost identical, and 1 specific dollar figure that was never even close between the two paths.Page 15
- 16A specific reason funded-account trading firms already write rules about this exact behavior, and it has nothing to do with protecting the trader.Page 16
- 17The exact line this report draws against every other report already in this shop, position by position.Page 17
- 185 written rules for sizing correlated positions as a group, including the 1 that says exactly what to do heading into a scheduled news event.Page 18
- 19A 5-question checklist for the exact moment a second or third related position gets considered, and the 4th question has nothing to do with whether the setup looks good.Page 19
- 20Every academic source behind this report spans 1952 to 2008, and not 1 of the 4 papers cited was originally written about trading.Page 20
HABITS
★
Certificate of Guarantee
60-Day, No-Questions-Asked
If The Double Exposure doesn't earn its place on your desk, email us any time within 60 days of purchase for a full refund. No form to fill out. No reason required.
Instant Download
$7One-time payment. No subscription.
Order Now20-PAGE PDF · DELIVERED IMMEDIATELY AFTER CHECKOUT · 60-DAY GUARANTEE
Behind The Report
Correlation And Portfolio Theory

Positions that look independent on separate charts can still be the same bet in disguise once they're overlaid.
The Concept
Three positions each risked at 1% of the account only add up to 3% of risk if the three positions move independently of each other. Correlated, the same three trades behave much closer to one larger bet, because they tend to win and lose together rather than separately.
That difference, between the risk written on paper and the risk actually sitting in the account, is where correlated exposure hides.
Where It Comes From
Harry Markowitz laid the mathematical groundwork in a 1952 Journal of Finance paper called "Portfolio Selection," written while he was still a graduate student. It became the foundation of modern portfolio theory, and Markowitz won the 1990 Nobel Prize in Economics largely for that single paper.
Shlomo Benartzi and Richard Thaler's 2001 American Economic Review study found that even professional investors tend to spread money naively across whatever options are offered, roughly equal amounts each, rather than accounting for how those options actually move together. Francois Longin and Bruno Solnik's 2001 Journal of Finance research went further, showing correlations between assets tend to rise specifically during market downturns, right when a trader least wants every position moving the same direction at once.
Three 1% Positions, By Correlation
Combined risk on three equally-sized 1% positions, using the standard portfolio formula 1% × the square root of (n + n(n−1)ρ), with n = 3. Fully independent positions run closer to 1.73% combined. Fully correlated positions run the full 3%, exactly as if it were one position three times the size.
Try It: Drag The Correlation On Your Own Three Positions
Same formula as the chart above, 1% × the square root of (n + n(n−1)ρ) with n = 3, run live as you drag ρ from fully independent to fully correlated. Three 1%-risk positions never exceed 3% combined risk, but how close they get to that ceiling depends entirely on how correlated they actually are.
Background only. The report itself works the closed-form combined-risk math and a 20,000-trial simulation of what correlated positions actually cost.
Common Questions
Do professional investors actually account for how their positions move together?
Not always. Shlomo Benartzi and Richard Thaler's 2001 American Economic Review study found even professional investors tend to spread money naively, roughly equal amounts across whatever options are offered, rather than accounting for correlation.
Does correlation stay the same in a downturn?
No, and that's the part that hurts. Francois Longin and Bruno Solnik's 2001 Journal of Finance research found correlations between assets tend to rise specifically during market downturns, right when a trader least wants every position moving the same direction at once.
How much does correlation change three 1%-risk positions' real combined risk?
A lot. Fully independent, three 1% positions combine to about 1.73% risk. Fully correlated, they combine to the full 3%, the same as if it were one position three times the size.
Sources & Further Reading
-
Markowitz, H. (1952). “Portfolio Selection.” The Journal of Finance, 7(1), 77-91.
The mathematical groundwork the combined-risk formula above runs live. Markowitz won the 1990 Nobel Prize in Economics largely for this paper.
-
Benartzi, S. & Thaler, R. (2001). “Naive Diversification Strategies in Defined Contribution Saving Plans.” American Economic Review, 91(1), 79-98.
Found even professional investors tend to spread money naively across whatever options are offered instead of accounting for how those options move together.
-
Longin, F. & Solnik, B. (2001). “Extreme Correlation of International Equity Markets.” The Journal of Finance, 56(2), 649-676.
Showed correlations between assets tend to rise specifically during market downturns, right when a trader least wants every position moving the same direction at once.