There's a moment inside a losing trade that decides everything, and it isn't the moment the stop-loss finally gets hit.
It isn't the entry being wrong, because the entry is often fine.
It isn't the market being unfair, because the exact same price action happens to traders who walk away untouched.
It isn't even the size of the first trade, because that one usually matched the plan.
It's the moment right after, when the price is a little lower and it looks cheaper instead of looking like new information.
Researchers who studied 10,000 actual brokerage accounts found investors sell their winners at roughly 1.5 times the rate they sell their losers.
A separate study of 189,530 traders and more than 40 million trades found something sharper: the habit gets 10% stronger specifically in the moment right after a loss, which is exactly the moment it feels most reasonable to add.
There's a name for what happens to the math the second that add gets placed.
Traders who've never heard the term are already paying it.
It isn't a fee. No bill ever shows up for it. It shows up as the extra gain a position now needs to get back to where it started, and that number does not grow in a straight line.
A position down 20% owes 25% back. A position down 50% owes 100% back. A position down 80% owes 400% back, before a single dollar of profit exists.
Every dollar added at the lower price does improve the average cost. It does not improve that curve. It only puts more capital on the hook to climb it.
One simulation built for this report ran 20,000 identical price paths through two sizing rules and changed nothing else. The rule that added to losers without a cap actually showed a profit more often than the one that didn't.
That's the part that makes the habit feel like it's working. The part that doesn't show up until the day it happens is the other number: the worst outcome under the capped rule was a few hundred dollars. The worst outcome under the uncapped rule, on the exact same market data, was nearly twenty times larger.
All of it is laid out below, with the exact page where each piece is discussed.
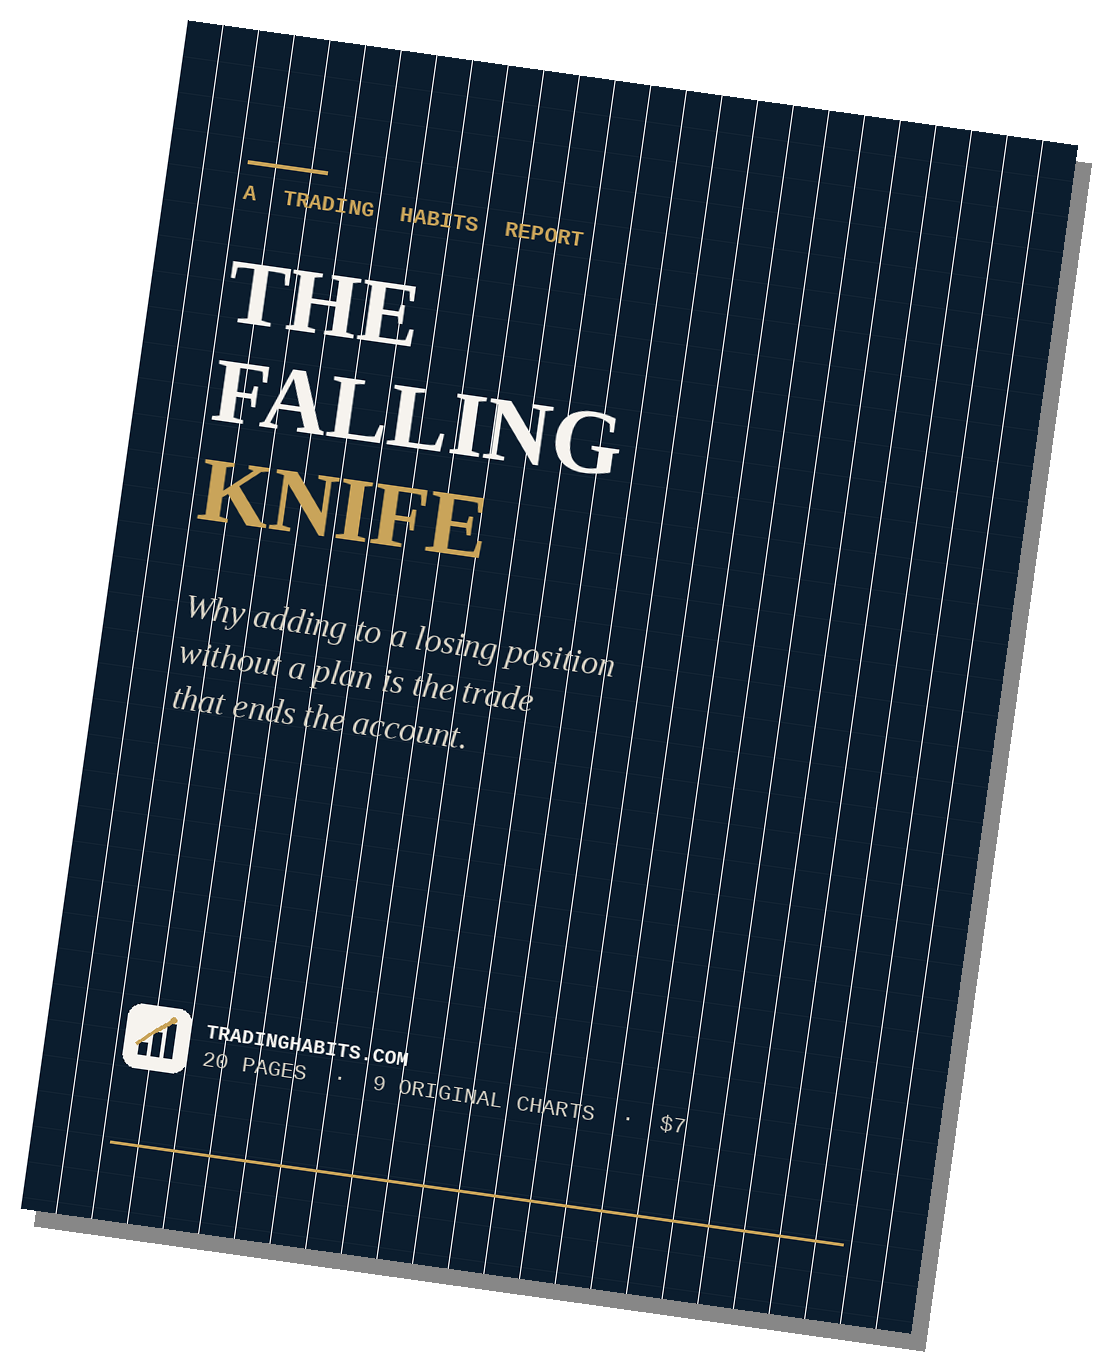
A Trading Habits Report
The Falling Knife
Why adding to a losing position without a plan is the trade that ends the account, and what the math and the research actually say about it.
- Length 20 pages, with 9 original charts and a worked hypothetical case study
- Author TradingHabits.com
- Format PDF, delivered as an instant download right after checkout
- Covers The psychology and math behind averaging down without a cap, a 20,000-path simulation of what it costs, and the specific rules that stop it
This report breaks down the research, the math, and a plan you can use the next time a position moves against you.
What's Inside
20 Things This Report Actually Says
- 01The three ordinary-sounding forms this habit takes, none of which feel like a mistake while they're actually happening.Page 3
- 02The exact math behind why a position down 50% needs a gain twice that size to get back to zero, before it makes a single dollar.Page 4
- 03What a 1998 study of 10,000 actual brokerage accounts found about the rate people sell their winners versus their losers, and it isn't close.Page 5
- 04The specific moment, measured across 40 million logged trades, when a trader is statistically most likely to make this exact mistake.Page 6
- 05Three separate mental shortcuts that stack on top of each other so an unplanned add doesn't even register as a new decision.Page 7
- 06What ten straight losses actually does to a position that started out "doubling it once or twice."Page 8
- 07The bankroll size an uncapped add plan actually requires to survive, and why no ordinary trading account is built anywhere close to it.Page 9
- 08The exact, computed odds of a 5-trade losing streak inside your next 100 trades, even at a win rate most traders would consider excellent.Page 10
- 09How 20,000 identical price paths were used to test this habit properly instead of relying on one lucky or unlucky story.Page 11
- 10Which sizing rule actually showed a profit more often in the simulation, and why that's the exact thing that makes the habit feel validated.Page 12
- 11The dollar difference between the worst-case outcome of a fixed stop and the worst-case outcome of an uncapped add, on the identical market data.Page 12
- 12The share of simulated paths where ordinary, unremarkable market noise alone was enough to trigger at least one add.Page 13
- 13How often the position grew to swallow 90% or more of the entire account, starting from a position that began as one-fifth of it.Page 13
- 14A hypothetical $10,000 account, three adds, and the exact percentage of the entire account riding on one position by the third one.Page 14
- 15What happened to the average cost per share versus what happened to total dollars at risk, laid out side by side.Page 15
- 16Four different markets where this exact pattern shows up, each one wearing a different disguise.Page 16
- 17The one-sentence distinction that separates a professional scale-in from the version that ends accounts.Page 17
- 18Five specific, written-in-advance rules built to hold at the exact moment an add feels least necessary to question.Page 18
- 19The five questions built to be asked before any add, not after.Page 19
- 20What the simulation says this habit costs when it finally goes wrong, measured against the version with a plan.Page 20
HABITS
★
Certificate of Guarantee
60-Day, No-Questions-Asked
If The Falling Knife doesn't earn its place on your desk, email us any time within 60 days of purchase for a full refund. No form to fill out. No reason required.
Instant Download
$7One-time payment. No subscription.
Order Now20-PAGE PDF · DELIVERED IMMEDIATELY AFTER CHECKOUT · 60-DAY GUARANTEE
Behind The Report
Averaging Down And The Sunk Cost Fallacy

Every add-on buy is a bet that the falling knife is done falling. The stack keeps growing either way.
The Concept
Averaging down means adding to a position that's already losing, at a worse price than the original entry, usually with no predetermined cap on how much more can go in. The trade started with a plan. The add-on usually didn't.
The sunk cost fallacy is the closely related habit of treating money already lost as a reason to keep going, instead of money that's already gone regardless of what happens next. Every dollar added to a losing position is a fresh bet, priced on the current chart, not on what's already been spent.
Where It Comes From
Hersh Shefrin and Meir Statman's 1985 Journal of Finance paper on the disposition effect covers this same reluctance to close a loser at a loss, the root instinct that makes "add a little more and it'll come back" feel reasonable in the moment.
The sunk cost fallacy itself was formalized by Hal Arkes and Catherine Blumer in a 1985 paper in Organizational Behavior and Human Decision Processes. It's the same logic error behind the popularized "Concorde fallacy," named for the supersonic jet program that kept getting funded years after it was clear it would never turn a profit, because too much had already been spent to stop.
Average Cost Basis vs. Total Dollars At Risk
Illustrative example: 100 shares at $50, then two equal-share adds as price falls. Gold bars are average cost per share. Green bars are total dollars now riding on the position. Average cost drops 12.5%. Total dollars at risk grows 250%.
Try It: Add To The Same Losing Position
Same three states as the chart above: 100 shares at $50, then two equal-share adds as price falls another 10% and 20%. Average cost barely moves. Total dollars at risk climbs 250% by the second add, on a position that started with a single, smaller plan.
Background only. The report itself works a 20,000-path simulation on what an uncapped average-down costs an actual account.
Common Questions
What's the difference between the disposition effect and the sunk cost fallacy here?
Hersh Shefrin and Meir Statman's 1985 paper covers the reluctance to close a loser at a loss, the instinct that makes adding more feel reasonable. Hal Arkes and Catherine Blumer's separate 1985 paper formalized the idea that money already spent gets treated as a reason to keep going, even though it's gone regardless of what happens next.
What is the "Concorde fallacy"?
The same sunk cost logic, named for the supersonic jet program that kept getting funded years after it was clear it would never turn a profit, because too much had already been spent to stop.
How much does averaging down actually change the risk, not just the average price?
A worked example on this page: 100 shares at $50, then two equal-share adds as price falls. Average cost only drops from $50.00 to $43.75, about 12.5%. Total dollars at risk grows from $5,000 to $17,500, up 250%.