There's a specific moment inside a winning streak that decides whether the streak ends the account or just ends itself.
It isn't the trade that finally loses.
It isn't the system breaking down, because the system usually hasn't changed at all.
It isn't even the losing streak that eventually follows, because every real edge produces one of those on a long enough timeline.
It happens three or four trades earlier, the moment size gets bumped up because the last few trades worked.
Researchers gave that decision a name: the house money effect.
Most traders have never heard the term.
Fewer still know a 1990 study found people will risk money they just won more freely than money that was already sitting in the account, even though a broker statement can't tell the difference between the two.
It isn't really about the streak. It's about which dollars feel like they're already spent.
One simulation built for this report holds a real, positive-edge system perfectly constant and only changes how much of the account gets risked per trade. At normal size, the odds of a serious drawdown round to zero. Scaled up the way a hot streak tempts most traders to scale, those odds cross 1 in 2.
Another walks a hypothetical $50,000 funded account through eleven trades. A four-win streak. A drawdown floor that rose right along with it. One ordinary loss that would have meant nothing at the original size instead ends the evaluation.
Neither one required a worse strategy.
Both required one sizing decision, made exactly when it felt least necessary to question it, that a flatter, more ordinary day would never have allowed.
That decision has a name, a body of research behind it, and a documented cost that shows up specifically in the trades right after your best week, not your worst one.
All of it is laid out below, with the exact page where each piece is discussed.

A Trading Habits Report
The Hot Hand Trade
Why sizing up after a winning streak is the moment discipline breaks down, and what the math says about it.
- Length 20 pages, with 8 original charts and a worked dollar case study
- Author TradingHabits.com
- Format PDF, delivered as an instant download right after checkout
- Covers The psychology behind sizing up after a winning streak, what it costs in worked-through numbers and simulations, and what the research says actually stops it
This report breaks down the research, the math, and a plan you can use on your next winning streak.
What's Inside
20 Things This Report Actually Says
- 01How the exact same setup gets a completely different risk assessment on trade five of a winning streak than it got on trade one, even though nothing about the setup changed.Page 4
- 02Three ordinary-sounding ways this pattern shows up in real accounts that don't feel like a mistake while they're happening.Page 4
- 03What a 1985 study of NBA shooting streaks proved about "hot hands," and what it has to do with your last four winning trades.Page 5
- 04The one question that separates a size increase you can defend from a size increase your last four trades talked you into.Page 6
- 05The mental accounting trick that makes money you just won feel less real than money that was already sitting in your account, and why that feeling is exactly backwards.Page 7
- 06Why a losing streak almost never costs a trader confidence at the same rate a winning streak hands it out.Page 8
- 07The risk-per-trade percentage where a real, positive-edge trading system's odds of a 90% drawdown jump from statistically nothing to over 1 in 2.Page 9
- 08Even a system that wins 70% of the time has a real, calculable chance of stringing together five straight losses somewhere in its next 100 trades.Page 10
- 09Same $10,000 account. Same 40 trades. Two sizing rules. One different ride.Page 11
- 10What happened to the size of the losses, not just the size of the gains, once the sizing rule started scaling with the streak.Page 11
- 11The exact dollar amount a hypothetical funded account's risk grew to after four wins in a row, and why that number mattered more than the win streak itself.Page 12
- 12Why a trader can follow the plan for the first nine trades of an evaluation, still be net profitable overall, and fail it anyway on trade ten.Page 12
- 13What 66,465 real brokerage households proved about the relationship between how much people trade and how much they actually keep.Page 13
- 14The households that traded the most didn't just underperform the market. They underperformed the households that traded the least.Page 13
- 15The structural reason funded-account evaluations tend to fail in the days right after a trader's best stretch, not their worst one.Page 14
- 16What 1,500 simulated trading accounts, all sharing the identical edge, looked like once the only variable changed was whether size scaled up after a win streak.Page 15
- 17The four-word phrase traders use most often to describe giving back two weeks of disciplined gains in a single afternoon.Page 16
- 18Why the traders most likely to fall into this exact pattern are usually the ones with a real, working edge, not the ones without one.Page 16
- 19Five specific rules, one of them a hard written cap most traders never set, built to hold when a size increase doesn't feel necessary to question.Page 17
- 20The five questions that separate a sizing decision made on a flat, ordinary day from one your winning streak made for you.Page 18
HABITS
★
Certificate of Guarantee
60-Day, No-Questions-Asked
If The Hot Hand Trade doesn't earn its place on your desk, email us any time within 60 days of purchase for a full refund. No form to fill out. No reason required.
Instant Download
$7One-time payment. No subscription.
Order Now20-PAGE PDF · DELIVERED IMMEDIATELY AFTER CHECKOUT · 60-DAY GUARANTEE
Behind The Report
The Hot-Hand Fallacy
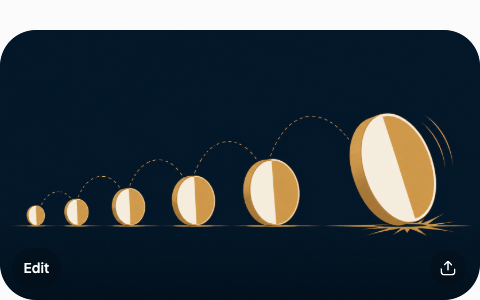
Each win in the streak gets a bigger bet riding on it. The streak doesn't know that. The odds don't either.
The Concept
The hot-hand fallacy is the belief that a streak of wins means the odds themselves have improved, when the process behind each individual outcome hasn't changed at all. Feeling hot and being hot are two different claims. Only one of them is measurable.
In a trading account, that belief shows up as bigger size after a few green trades in a row, on the theory that the edge got stronger. Usually nothing about the setup, the market, or the strategy changed. What changed was confidence.
Where It Comes From
Psychologists Thomas Gilovich, Robert Vallone, and Amos Tversky coined the term in a 1985 Cognitive Psychology paper studying basketball shooting streaks. For over three decades, "hot hand" was treated as a textbook example of a real cognitive bias.
Then a 2018 study found a statistical flaw in how the original research measured streaks, one that had undercounted real hot-hand effects. The debate over whether hot streaks are ever real is still active. What isn't in dispute: a trader acting on a felt streak, real or not, tends to size up right before variance catches up.
The Odds Don't Move. The Size Does.
Illustrative position-size escalation across a five-trade winning streak, holding a 50% win rate the entire time by definition of a fair, independent process. The bars climb. The dashed line, the actual probability of the next trade winning, does not move.
Try It: Size Climbs. The Odds Don't.
Drag through the same five-trade streak as the chart above. The size multiplier climbs the way it tends to in most traders' heads. The win probability, fixed at 50% for a genuinely fair, independent process, stays exactly where it started throughout.
Background only. The report itself runs the simulation on what sizing up after a winning streak does across thousands of trades.
Common Questions
Is the "hot hand" definitely a myth?
Not settled, actually. Gilovich, Vallone, and Tversky's original 1985 paper treated it as a bias for three decades. A 2018 study found a statistical flaw in how the original research measured streaks, one that had undercounted real hot-hand effects. The debate over whether hot streaks are ever real is still active.
What isn't in dispute, even with that debate going on?
That a trader acting on a felt streak, real or not, tends to size up right before variance catches up. The report's own example holds win probability fixed at 50% for a genuinely fair process across a five-trade streak, and the size multiplier still climbs from 1.0x to 2.5x.
Does a winning streak actually change the odds of the next trade?
Not for a fair, independent process. The size multiplier climbs. The actual win probability stays exactly where it started throughout.