One hour decides more of the session than the other five and a half combined, and most traders never approach it on purpose.
9:30 to 10:30 carries a disproportionate share of the day's volume and range. Every order that built up overnight, every stop, every rebalance, every first reaction to the news, clears into that single window. Most traders show up for it with a coffee and a guess.
The first candle looks like a signal. A gap looks tradeable. The breakout looks real. Some of it is. Wider spreads and thinner order books right at the bell mean a convincing-looking move can reverse on a fraction of the size it would take an hour later, and there's no way to tell the genuine setup from the trap without a specific, mechanical read.
The first 5-minute candle. An opening range. Gap and go explains why some gaps fill and some don't. The opening drive versus a fakeout in progress. Failed breakouts, VWAP anchored from the open, and the first pullback that decides whether the move actually continues.
Ten modules. The specific mechanics of the hour this entire site keeps pointing back to, built for someone ready to trade it on purpose instead of on adrenaline.
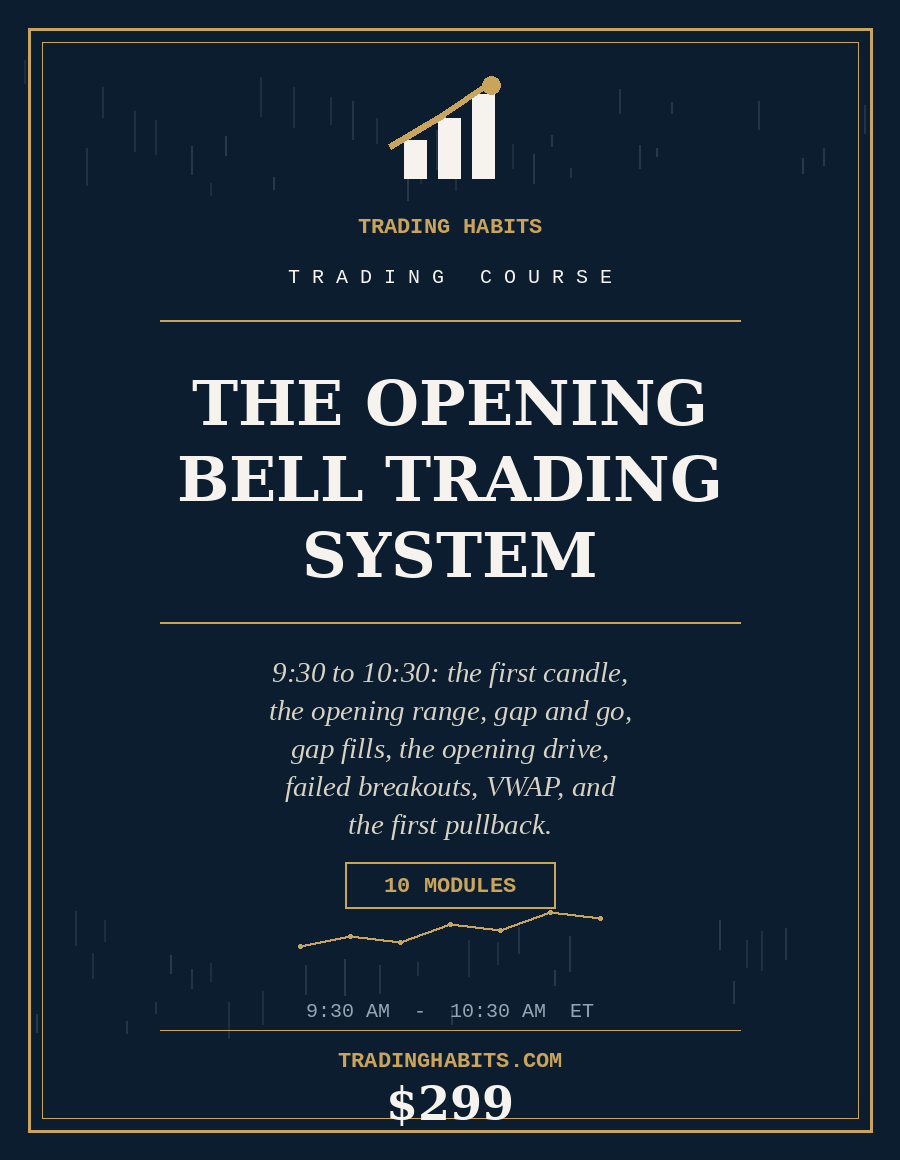
A Trading Habits Course
The Opening Bell Trading System
9:30 to 10:30: the first candle, the opening range, gap and go, gap fills, the opening drive, failed breakouts, VWAP, and the first pullback.
- Length 10 modules, built for genuine depth, not padding
- Format A private, self-paced course page with working opening-range, gap-percentage, and VWAP-distance calculators built into the lessons, not links out to them
- Access Instant, right after checkout, yours to re-read for good
- Covers Auction mechanics at the open, the first 5-minute candle, the opening range across 5/15/30-minute windows, gap and go, gap fills, the opening drive, failed breakouts, VWAP anchored from 9:30, the first pullback, and an 8-week paper-to-live ramp
- Author TradingHabits.com
Built for one job: turning the first hour from the most-watched, least-understood part of the session into a window traded on a specific, repeatable read instead of a feeling.


What's Inside
The 10 Modules
- 01Why the first hour trades differently: overnight order imbalance resolving into the open, and a disproportionate share of the day's volume and range.Module 1
- 02The first 5-minute candle: what its range, body, and volume tell you, and what they can't.Module 2
- 03Opening range across 5, 15, and 30-minute windows, and what an OR is measuring.Module 3
- 04Gap and go: trading the gap's direction, with the liquidity and character checks before treating it as continuation.Module 4
- 05Gap fills: the mechanics behind why some gaps hold and some fill, with no fixed percentage stated as fact.Module 5
- 06The opening drive: reading whether a strong first push is genuine or a fakeout in progress.Module 6
- 07Failed breakouts in the first hour: bull and bear traps built on thinner liquidity right after the bell.Module 7
- 08VWAP in the first hour: anchor mechanics from 9:30, first-touch behavior, and the reclaim/reject read.Module 8
- 09The first pullback: what makes it a valid re-entry, and exactly what invalidates it.Module 9
- 10A first-hour routine, five behavioral failure patterns specific to the open, and an 8-week paper-to-live ramp.Module 10
Read This Before You Buy
Who This Course Actually Fits
You're a fit if
- You already trade the open, or want to, and want the actual mechanics behind the first candle, the opening range, and VWAP instead of a vague sense that "the open is important."
- You've watched a gap fill sometimes and hold other times and want to understand why, instead of a single memorized number.
- You want a specific way to tell a genuine opening drive from a fakeout, and an actual breakout from a bull or bear trap.
- You're willing to build and follow a first-hour routine rather than trading the open on adrenaline.
- You're comfortable with a small, structured paper-to-live ramp instead of trading full size on day one.
Skip it for now if
- You're looking for alerts, a chat room, or a signal feed. This is a system to understand, not a feed to follow.
- You've never placed any kind of trade before. This course assumes basic familiarity with charts and orders.
- You want a guarantee on how often a gap fills. No course can honestly offer that, and Module 5 explains exactly why.
- You're already reading the opening range, VWAP, and the first pullback with a process you trust. You may already have what this course teaches.
HABITS
★
Certificate of Guarantee
60-Day, No-Questions-Asked
If The Opening Bell Trading System doesn't earn its place in your process, email us any time within 60 days of purchase for a full refund. No form to fill out. No reason required.
Instant Access
$299One-time payment. No subscription.
Get Instant Access10-MODULE DIGITAL COURSE · DELIVERED IMMEDIATELY AFTER CHECKOUT · 60-DAY GUARANTEE
Behind The Course
Why the Open Behaves the Way It Does
1988, The Review of Financial Studies
Economists Anat Admati and Paul Pfleiderer published a model explaining why trading volume and price volatility both cluster at the open and the close of a session, with a quieter stretch between the two, a pattern now widely referred to as the U-shaped intraday curve. The mechanism: traders with information or a need to transact prefer to act when the most other volume is also acting, since that's when their own order carries the least price impact.
1990, Toby Crabel
Trader Toby Crabel formally documented and popularized the opening range breakout in his book Day Trading with Short Term Price Patterns and Opening Range Breakout, built on statistical work examining how often an early-session range predicted the rest of the day's movement.
Two Dated Ideas Behind Why the First Hour Gets Studied This Closely
Two years apart, one explaining why the open carries so much of the day's volume, the other giving traders a formal way to measure the range it prints.
Try It: The Opening Range Math From Module 3
Same formula Module 3 works through in full: high minus low, divided by the low, gives the range as a percentage of price. Every opening-range read in the course starts here.
Background only. The course itself works the first-candle, gap, opening-drive, VWAP, and pullback mechanics a first-hour trader runs on.
Common Questions
Why does the first hour carry so much of the day's volume?
Admati and Pfleiderer's 1988 model explains it as traders with information or a need to transact preferring to act when the most other volume is also acting, since that minimizes their own order's price impact. The open is the first point in the session where that condition exists.
Do all gaps fill eventually?
No, and Module 5 states directly that no fixed percentage is a settled fact. Some gaps represent genuine repricing and tend to hold. Others represent an overreaction that gets worked off as deeper liquidity arrives. Published figures on how often gaps fill vary by study, timeframe, and gap size.
Where does the opening range breakout come from?
Trader Toby Crabel formally documented and popularized it in his 1990 book, built on statistical work on how often an early-session range predicted the rest of the day. Module 3 works through the actual math behind measuring one.
Sources & Further Reading
-
Admati, A. & Pfleiderer, P. (1988). “A Theory of Intraday Patterns: Volume and Price Variability.” Review of Financial Studies, 1(1), 3-40.
The model explaining why volume and volatility both cluster at the open and the close, the U-shaped curve this course's early modules are built around.
-
Crabel, T. (1990). Day Trading with Short Term Price Patterns and Opening Range Breakout. Traders Press.
The opening-range-breakout book this course's Module 3 tool is built on.