Every trader who has watched a stock hover suspiciously close to a round number the week options expire has heard someone call it "max pain." Almost none of them have read the actual study.
A 2005 paper in the Journal of Financial Economics tracked thousands of expirations and found genuine clustering at strike prices. Measurable, but small. About one percentage point of difference, concentrated mostly in thinner, smaller names, not the dramatic magnet act it gets described as on trading forums.
Meanwhile the dollar figures at stake have stopped being small. Three record-breaking quarters in a row, each one bigger than the last, rewrote the history books for how much money rolls off the board on a single day.
This report built an original simulation to answer a question the academic papers leave open: before any dealer hedging story gets added, how much of a "pin" near a strike is ordinary statistical noise. Twenty thousand simulated expirations. One clean, isolated number.
The most recent triple witching cleared an estimated $7.1 trillion in notional value in a single session, the largest ever recorded. And the report's own random-walk simulation found that roughly 1 in 10 closes lands within a quarter near a strike from pure chance alone, with zero gamma, zero hedging, and zero manipulation involved. Both numbers, and everything behind them, are below.
All of it, with the exact page number next to each one.
A Trading Habits Report
The Options Expiration Report
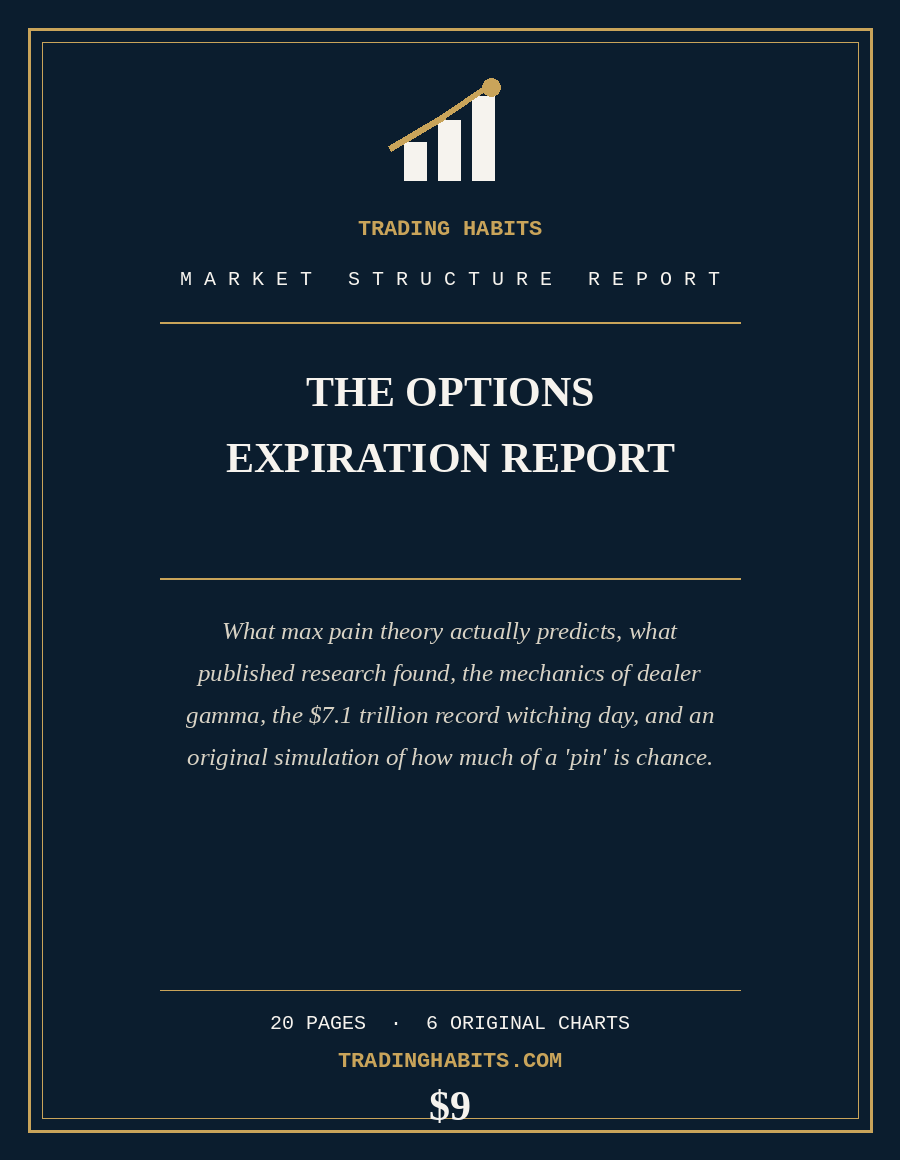
What max pain theory actually predicts, what published research found, the mechanics of dealer gamma, the $7.1 trillion record witching day, and an original simulation of how much of a "pin" is ordinary chance.
- Length 20 pages, with 6 original charts and a 20,000-run simulation
- Author TradingHabits.com
- Format PDF, delivered as an instant download right after checkout
- Covers expiration mechanics, max pain theory, the published academic research, dealer gamma, the record December 2025 witching day, and an original chance-versus-pin simulation
No stock is picked, ranked, or listed anywhere in this report. SPY appears exactly once, as a fully hypothetical mechanics example, never as a recommendation.
What's Inside
20 Things This Report Actually Says
- 01The actual difference between a routine weekly expiration and one of the four triple witching dates a year.Page 4
- 02Why 0DTE contracts now make up 65 percent of total SPX options volume, and what that changed.Page 4
- 03Schaeffer's own 14-event data set: what the Thursday and Friday of a triple witching week average.Page 5
- 04The exact $7.1 trillion breakdown behind December 19, 2025's record expiration, per Goldman Sachs.Page 6
- 05How that record climbed three quarters in a row, from $5.1 trillion to $6.5 trillion to $7.1 trillion.Page 6
- 06Open interest and strike price, the two raw numbers every theory in this report starts from.Page 7
- 07Max pain theory, explained the way it's claimed to work, no hand-waving.Page 8
- 08The 2005 Journal of Financial Economics study: 19 percent clustering versus 18 percent, and what that $9 billion figure means.Page 9
- 09A 2021 "No Max Pain, No Max Gain" paper, and why its own authors call the effect a reversal, not a magnet.Page 9
- 10The honest summary of both studies lined up together, without the trading-forum exaggeration.Page 10
- 11Dealer gamma exposure (GEX), the metric SqueezeMetrics first published in March 2016, explained in plain English.Page 11
- 12Long gamma versus short gamma, and why the same market can either pin a price or blow through it.Page 11
- 13The "gamma cliff": why some of the sharpest post-expiration moves show up with no headline attached.Page 12
- 14Why monthly expiration carries less weight than it used to, in one chart.Page 13
- 15A fully hypothetical, hand-worked SPY walkthrough tying every mechanic in the report together.Page 14
- 16An original simulation, 20,000 runs deep, built from scratch in Python and NumPy for this report.Page 15
- 17The result: how much of a near-strike close is pure statistical noise, before gamma ever enters the picture.Page 15
- 18What assignment and exercise obligate each side of a contract to do into expiration.Page 17
- 19Eight questions to run before you trade into any expiration date.Page 18
- 20Seven sources, from the original 2005 academic paper to Cboe's own 2026 earnings materials, listed with exactly what each one backs up.Page 19
HABITS
★
Certificate of Guarantee
60-Day, No-Questions-Asked
If The Options Expiration Report doesn't earn its place on your desk, email us any time within 60 days of purchase for a full refund. No form to fill out. No reason required.
Instant Download
$9One-time payment. No subscription.
Order Now20-PAGE PDF · DELIVERED IMMEDIATELY AFTER CHECKOUT · 60-DAY GUARANTEE
Behind The Report
Three Records In A Row, And One Number Still Missing From The Debate
From $5.1 Trillion To $7.1 Trillion
Goldman Sachs pegged the notional value expiring on December 19, 2025 at roughly $7.1 trillion, including about $5 trillion tied to S&P 500-linked contracts, an estimated 10.2 percent of the entire Russell 3000's market capitalization in a single session.
That broke the prior record of roughly $6.5 trillion set in June 2025, which had itself broken the approximately $5.1 trillion record from December 2024. Three consecutive quarters, each one bigger than the last.
What Nothing Had Isolated Yet
The academic research behind Section 6 measured actual clustering at strike prices. It never isolated how much of that comes from pure chance alone, before any gamma-hedging story gets added on top.
So this report built its own simulation from scratch: 20,000 independent random walks, stated assumptions, zero hedging behavior modeled. No stock, fund, or ticker is picked, ranked, or listed anywhere in this report or on this page.
Three Consecutive Records, In One Chart
A simplified rendering of the record-climb chart discussed on page 6 of the report. Background only. The report itself covers the exact sourcing behind every one of these figures.
Try It: An Illustrative Move-Size Odds Calculator
A simple normal-distribution estimate using the same random-walk math behind the report's own Section 11 simulation, not a forecast, not gamma-adjusted, and not tied to any actual security. This estimates the odds of finishing within a stated distance of today's hypothetical price after N days. It does not model dealer hedging, open interest, or any specific stock. The full 20,000-run pin-distance simulation is in the report.
Background only. Nothing on this page or in this report is a recommendation to buy, sell, or hold any security, or to trade around any specific expiration date.
Common Questions
Does max pain theory actually work?
Partly, and much less dramatically than trading-forum posts suggest. A 2005 Journal of Financial Economics study found genuine but modest clustering at strike prices on expiration dates, about one percentage point more than non-expiration Fridays. One more recent paper found a stronger effect concentrated almost entirely in small-cap, thinner-volume stocks, and its own authors describe the pattern as a reversal effect, not proof that option positioning pulls price toward a strike. The report covers both studies directly, on page 9.
What is dealer gamma, in plain English?
It's an estimate of how much stock market makers need to buy or sell to stay hedged as prices move, aggregated across every strike they're positioned in. When dealers are net long gamma, their hedging tends to lean against a move, which can support price pinning near a heavily traded strike. If they're net short gamma instead, hedging leans with the move, which can amplify it. The report walks through the full mechanism, with a diagram, on page 11.
Where does the "$7.1 trillion" figure come from?
Goldman Sachs's own notional-value estimate for the December 19, 2025 triple witching, as reported in contemporaneous financial press coverage: roughly $7.1 trillion total, including about $5 trillion in S&P 500-linked contracts and $880 billion in single-stock options. It broke the prior record of $6.5 trillion set only six months earlier. The full breakdown is on page 6.
Does this report tell me how to trade an expiration date?
No, and it isn't trying to. It lays out the mechanics, the published research, dealer gamma, the record dollar figures, and an original simulation, then hands you an eight-question checklist on page 18 to run before you trade into your own next expiration. No stock is picked, ranked, or listed anywhere in it, and SPY appears exactly once, as a fully hypothetical mechanics example, never as a recommendation.